
Journal of Diabetes Management and Metabolism
Research Article
Evaluation of the Non-Invasive Glucose Monitoring Device egm1000TM in Patients with Type 2 Diabetes and Subjects with Prediabetes
Pfützner A*1,2, Sachsenheimer D1, Hanna MR1, Lier A1 and Anke H1
1Pfützner Science & Health Institute, Mainz, Germany
2University for Digitalized Technologies in Medicine & Dentistry, Wiltz, Luxembourg, Germany
*Corresponding author: Andreas Pfützner, fützner Science & Health Institute, Mainz, Germany, Tel: +4961315874640, Fax: +49613158744, Email: andreas.pfutzner@pfuetzner-mainz.com
Citation: Pfützner A, Sachsenheimer D, Hanna MR, Lier A, Anke H (2019) Evaluation of the Non-Invasive Glucose Monitoring Device egm1000TM in Patients with Type 2 Diabetes and Subjects with Prediabetes. J Diabetes Metab Manag: JDMM-100005
Received date: 14 July, 2019; Accepted date: 22 July, 2019; Published date: 29 July, 2019
Abstract
Objectives: The non-invasive egm1000 blood glucose monitoring device is the first CE-approved device for type 2 diabetes patients and prediabetes. The device assesses three physiological conditions at the earlobe, associated with tissue glucose concentrations (ultrasound, electromagnetic, and thermal). We performed this study to evaluate the performance of the device during a standardized meal test.
Methods: This device evaluation was performed in Germany and Egypt in summer 2016 with 27 participants (20 type 2 diabetes patients, 4 females, 68 ± 8 yrs; HbA1c: 7.2 ± 1.0%, BMI: 32.1 ± 4.7 kg/m², and 7 prediabetic subjects, 2 women, HbA1c: 5.8 ± 0.3%, BMI: 30.4 ± 5.9 kg/m²). After prior individual calibration with a Hemocue blood glucose meter, the patients ingested a standardized breakfast at the site in the next morning. Blood glucose was measured every 30 min over 180 min with Hemocue, Accu Chek Performa and YSI Stat 2300. Mean absolute relative difference (MARD) and a consensus error grid analysis were calculated against the YSI reference method.
Results: In the consensus error grid, 100 % of the egm1000 results were within the clinically accepted zones A and B (62.4 % and 37.6 %). MARD vs, YSI of the Hemocue-calibrated egm1000 devices was found to be 19.7 % (17.5 % vs. Hemocue). The performance was similar in diabetes patients and prediabetes subjects.
Conclusions: The current data confirms the egm1000 device performance among its intended users, including pre-diabetic patients, for pain-free non-invasive monitoring of glucose levels.
Keywords: Blood glucose monitoring; Diabetes mellitus; Non-invasive glucose monitoring; Patient self-measurement; Prediabetes
Introduction
Blood glucose measurement is a frequent procedure in the treatment of patients with diabetes mellitus and essential to prevent diabetic complications [1,2]. It has been shown that more frequent assessment of glucose by the patient is associated with better glycemic control and in a reduction of overall morbidity and mortality [3]. The necessity to always obtain a capillary blood sample (e.g. from the fingertip or the earlobe), the inconvenience and pain, and the costs associated with always using a new test strip, makes it a cumbersome procedure, which is disliked by the affected patients. This situation results in a remarkably high non-compliance, even if patients are urged to test more often [4,5]. The availability of regular blood glucose readings is critical to achieve intensive treatment goals, but in an ideal world regular blood glucose testing should also occur in orally treated patients with type 2 diabetes or pre-diabetes to better catch the time-point when intensification of treatment is required to maintain target glycemic control [6]. Furthermore, current IDF recommendations, supported by various studies, suggest self-measurement of blood glucose by the patients (SMBG) to be beneficial in self-management and on-going education for treatment and life-style changes customization in non-insulin treated individuals in general [7-11], and in particular also in newly diagnosed type 2 individuals [12-13]. The development of non-invasive methods for determination of blood or tissue glucose has therefore become a major goal in diabetes technology during the last decades. The physical methods used to assess specific glucose signals in blood, tissue, saliva, retinal fluid, and other organs include, but are not limited to (near/mid)infrared spectroscopy, photoacoustic spectroscopy, terahertz spectroscopy, raman spectroscopy, radio impedance spectroscopy and optical rotation [14]. It is of note that the device developments usually only focus on one of the beforementioned technologies, and no device with a suitable clinical accuracy has yet reached the market and has become a commercial success.
An attempt to obtain a valid glucose signal by combining several assessment methods has become reality with the new egm1000 non-invasive blood glucose meter (evia Medical Technologies, Surry, UK), which employs three different technologies to measure tissue glucose with a clip at the earlobe (phase shift as assessed by ultrasound, tissue conductivity, and the heat capacity of the tissue as assessed by calorimetry). egm1000 combines their results by using a proprietary algorithm to deliver a tissue glucose reading. The device has already been approved in Europe (CE) and in many countries in the Middle East for glucose monitoring and is intended for home use in non-invasive quantitative spot measurement of glucose for adult patients (over age 18) with type 2 diabetes and pre-diabetic subjects. After an initial calibration, the ear clip can be used for 6 months and the device can be used with individualized ear clips by up to 3 patients. The purpose of this trial was to demonstrate the egm1000 accuracy and precision in monitoring glucose levels in comparison to the YSI Stat2300 reference method and by using the acceptance criteria as defined by ISO15197 [15].
Materials and Methods
The study was conducted in compliance with the rules and regulations as set forth by ICH-GCP guidelines, the Declaration of Helsinki, as well as national and local clinical trial regulations. The protocol was approved by the responsible institutional review board and the patients signed written informed consent, before any study procedure was performed. Patient could participate, if they had type 2 diabetes or prediabetes (as defined by impaired glucose tolerance) and were not treated with regular insulin or any regimen involving insulin analogs. Exclusion criteria were anatomical conditions at the earlobe preventing the correct use of the ear clip. The primary objective of this open-label prospective study was to investigate the accuracy performance of the egm1000 device in monitoring glucose levels during a standardized meal experiment after calibration of the device at least one day prior to the meal-test by using the Hemocue Glucose RT201 system as calibration reference device.
Study device: egm1000 is a CE-mark approved non-invasive glucose monitoring device for individuals, to be used at home and in-door environment. The device is battery operated and includes 2 subunits: Main Unit containing a color touch screen display and control, transmitter, receiver and processor, and a Personal Ear Clip, containing sensors and calibration electronics, that is attached (externally clipped) to the earlobe, to perform a non-invasive monitoring. Figure 1 shows the device and illustrates how a measurement is performed. The principle of operation is based on measuring physiological phenomena which are correlated with glucose levels in the body. The “translation” of the measured signals into glucose reading is done by individual calibration, which also reduces the impact of quasi-stable components in the earlobe tissue. The measurement is conducted by three independent technologies, which act sequentially, to not interfere with each other. Since the whole process takes about a minute, from the user's point of view the measurement is considered as simultaneous. The three independent readings are combined by a proprietary algorithm, which calculates their weighted average.
egm1000 combines the following technologies ultrasound assessment (phase shift as a function of speed of sound change within the tissue); electromagnetic assessment (conductivity of the tissue); thermal assessment (heat capacity of the tissue). The combined end-result (reading) is displayed to the user on a large color screen, as well as announced verbally. Extreme values, pre-determined by the user, evoke visual and audible alerts. The device does not require sterilization and does not have any disposable components. The Ear Clip life span is 6 months from first use; after which it must be replaced.egm1000 is intended for use in non-invasive quantitative spot measurement of glucose, for home-use. It is approved for use by adult patients (> 18 yrs.) with type 2 diabetes and pre-diabetic subjects. Medications in take treatment decisions should not be based on measurements by egm1000, and it should not be used for diagnosis.
Calibration procedure: On the first study day, the patients signed informed consent and underwent a calibration procedure, which was performed by the investigators. For calibration, the patients were measured with the study device, the YSI reference method and the Hemocue device three times with 10 min intervals between each assessment. At each time-point, the Hemocue reading was entered into the egm1000 device, while the YSI result was recorded for a later calibration simulation.
Meal-test protocol: The patients came to the study site after an overnight fast for at least 8 h. After an initial capillary blood sampling and glucose measurement with the YSI and the Hemocue device, and an additional glucose measurement with the study device, they ingested a standardized breakfast, which was composed of two pieces of rye bread roll with cream cheese and water (water ad libitum, total carbohydrate uptake: 24 g). Further blood glucose assessments with all three methods were performed at time-points 30 min, 60 min, 90 min, 120 min, 150 min, and 180 min. Thereafter, patients were allowed to leave the site, if their blood glucose levels were below 180 mg/dL. Assessment of precision was done with 5 subjects. Each subject was simultaneously calibrated with two egm1000 devices at visit 1. Each device was applied to a different earlobe, using the same invasive reference glucose values. At visit 2, the investigators conducted all 7 measurements with 30 minute intervals with both egm10000 devices, which were applied in parallel.The YSI Stat2300 Glucose Analyzer (YSI) was used as the primary reference method for the meal experiment and the consecutive analysis. In addition, Hemocue readings were performed at every timepointfor additional analyses.
Statistical methods: The statistical analysis was performed using appropriate parametric and non-parametric methods. Demographic data of the patients was tabulated and data points were individually listed. The accuracy analysis of the results was performed in accordance with the requirements of the ISO standard for self-monitoring of blood glucose. The acceptance criteria allow for a deviation from the reference method of ± 15mg/dL ( ± 0.8mmol/L) for readings < 100mg/dL (5.5mmol/L) and ± 15% for readings ≥ 100mg/dL. The mean absolute relative difference to the reference method (MARD) was calculated, and the clinical implications of the results were assessed by means of a consensus error grid analysis as published previously [16,17] (Parkes, Pfützner). Precision was determined by calculation of the precision absolute relative difference (PARD).
These analyses were performed twice by using the YSI reference in a first analysis and the Hemocue reference in the second analysis. In addition, a retrospective simulation of a YSI calibration was performed and subjected to the same analyses.
Results
In total, 224 measurements (within a YSI range of 82 mg/dL to 278 mg/dL) from 20 type 2 diabetes patients (4 women, 16 men, age ( ± STD): 68 ± 8 yrs, HbA1c: 7.2 ± 1.0%, BMI: 32.1 ± 4.7 kg/m²) and 7 pre-diabetic patients (2 women, 5 men, age: age: 64 ± 10 yrs., HbA1c: 5.8 ± 0.3%, BMI: 30.4 ± 5.9 kg/m²)were performed and evaluated in this study. In the accuracy part of the study, 189 measurements were collected. An additional 35 data points were obtained during the precision part of the protocol. No device related adverse events were recorded following the use of egm1000. No skin injuries or other local anatomical complications at the earlobe, such as skin irritation, burning or discomfort were observed.The mean glucose curves for the entire patient population are provided in (Figure 2).
It can be seen that there was a lag-time between the non-invasive egm1000 reading and the invasive capillary reference methods of 10-15 min, when the glucose values raised and ~ 30 min when the glucose values dropped after reaching the postprandial maximum level.
The percentage of egm1000 resultsfor glucose values > 100 mg/dL within ± 15 % was 50 .3 % when compared to the YSI reference method (Hemocue: 55.0 %), and 20.0 % for glucose values ≤ 100 mg/dL within ± 15 mg/dL (Hemocue: 20 .0 %). In the consensus error-grid analysis, 100 % of the readings were found to be in the clinically acceptable zones A and B when compared to YSI (64.0 % and 36.0 %, respectively). A similar result was obtained when comparing to the Hemocue readings (68.8 % and 31.2 %, respectively). The two consensus error-grid plots are provided in (Figure 3). MARD was calculated to be 19.7 % when compared to YSI (median absolute relative deviation: 15.9 %) and 17.5 % when compared to the Hemocue readings (median absolute relative deviation: 17.7 %). The calculation of the precision absolute relative difference (PARD) resulted in a value of 9.5 ± 4.5 %.
Discussion
The frequent monitoring of glucose is an essential part of diabetes management. Because almost all the commercially successful blood glucose monitoring devices are invasive, there is an immense need to develop non-invasiveglucose monitoring devices that will alleviate the pain and suffering of diabetics associated with the frequent pricking of skin for taking the blood sample for glucose testing. There have been numerous developments in the field of non-invasive glucose monitoring during the last decade, but as of yet none of the technologies has finally reached a state where a device became suitable for clinical practice. The egm1000 glucose meter is the first device that uses three different methods to assess the glucose concentration in the tissue of the earlobe and that has been approved for glucose monitoring in Europe and Middle East. In this trial, we evaluated the accuracy and precision of the device when calibrated with a point of care method (Hemocue) in comparison to a standard reference method (YSI) and achieved encouraging results. All values in the consensus error grid analysis were in the clinically acceptable zones A and B, which means that any glucose treatment decision based on these values would not have harmed the patient. The device is in any case suitable for the intended purpose, i.e. for frequent and pain-free monitoring glucose in patients at risk to develop type 2 diabetes and for diabetes patients on lifestyle and oral treatment. The technologies implemented in the egm1000 device do not directly measure tissue glucose concentration, but rather physiological effects associated with the glucose concentrations in the different tissue compartments (blood, interstitial fluid, cellular fluid).
Ultrasound: An ultrasonic wave travels from a transmitter, placed on one side of the earlobe, through the earlobe tissue and is received by a detector at the other side [17] showed that the sound velocity depends linearly on the glucose concentration in a water-glucose solution. They also described that sound velocity dependency on temperature is more significant than that of the glucose concentration. On the other side, glucose-induced water transport affects tissue density as well as compressibility and they also affect the sound velocity [18]. Therefore, a temperature sensor is employed to correct for temperature influence in the egm1000 ear clip.
Electromagnetic conductivity: The device has two parallel foils, which act like capacitor plates utilizing the earlobe tissue as a dielectric material. Application of an electric current between the two plates stimulates the earlobe tissue and allows for impedance assessment. Plasma glucose induces ion shift across the cellular membrane in red blood cells and changes the membrane potential [19,20] demonstrated that variations of the metabolically active enantiomer d-glucose affect the permittivity and conductivity of the cellular membranes. Tissue impedance is changed due to changes in blood glucose concentration and can therefore be monitored to provide glucose information [21].
Calorimetry (heat capacity of the tissue): A known (controlled) amount of energy is applied to the earlobe using a heat source for a predetermined period of time. The temperature developed on the earlobe as a result of the heating is glucose-dependent. Therefore, a bio-heat transfer equation can be applied, which describes the thermal properties changes of a living tissue [22].
All employed methods indirectly measure changes in physiological conditions in the earlobe derived from changes in the local glucose concentrations and are associated with the absolute levels of glucose in the earlobe tissue. It is an accepted notion that interstitial glucose is “delayed” with respect to blood glucose, but this does not mean that tissue glucose is simply a shifted-in-time version of blood glucose [23]. It has been shown that in the overnight fasted state in type 1 diabetes adults, the delay of glucose appearance from the vascular to the interstitial space is less than 10 minutes [24]. The meal related time lag can be longer, in particular when the glucose levels go down after reaching the peak blood glucose excursion and has been measured to be up to 45 min in patients with type 2 diabetes with minimally invasive glucose sensors or by alternate site testing [25-28]. The observed mean lag-time between the reference readings and the egm1000 results of 10-15 min when glucose raises and ~30 min, when glucose drops, are therefore in line with results obtained from minimally invasive continuous glucose sensor experiments. These findings indicate that the major component contributing to the egm1000 signal is indeed the interstitial glucose concentration and not capillary or venous glucose levels. In our opinion, these delays do not compromise the main intention of using egm1000, which is to identify the right time, when it becomes necessary to e.g. intensify the currently applied treatments.
Our study has several limitations, which need to be considered before potentially drawing conclusions for daily routine care. Firstly, we only performed one experimental visit one day after the calibration procedure to test the system accuracy in comparison to a capillary blood glucose reference method. It will be important to understand the long-term performance and validity of the applied calibration procedure. Secondly, it is unclear whether capillary glucose is indeed the right reference method for this non-invasive device, which is supposed to assess physiological conditions changing with glucose tissue variations. However, YSI is a globally accepted standard reference method for blood glucose meters for patient self-testing and will therefore always be a considerable benchmark also for non-invasive devices. Finally, our study has only a small cohort size. Further studies in larger patient populations are in any case warranted to understand and confirm the long-term impact of egm1000 on routine diabetes care.
Conclusion
A non-invasive method allows for performance of unlimited measurements e.g. to identify the right timepoint to initiate treatment efforts in prediabetes patients. In orally treated patients with type 2 diabetes, more frequent measurements may help to identify the time-point, when treatment regimens should be intensified. For this purpose, the applied assessment technology has to comply with clinical and regulatory acceptance criteria. In our study, egm1000 fulfilled these criteria and we were able to confirm the accuracy and precision results, which recently lead to the approval of the device for glucose monitoring in patients with type 2 diabetes.
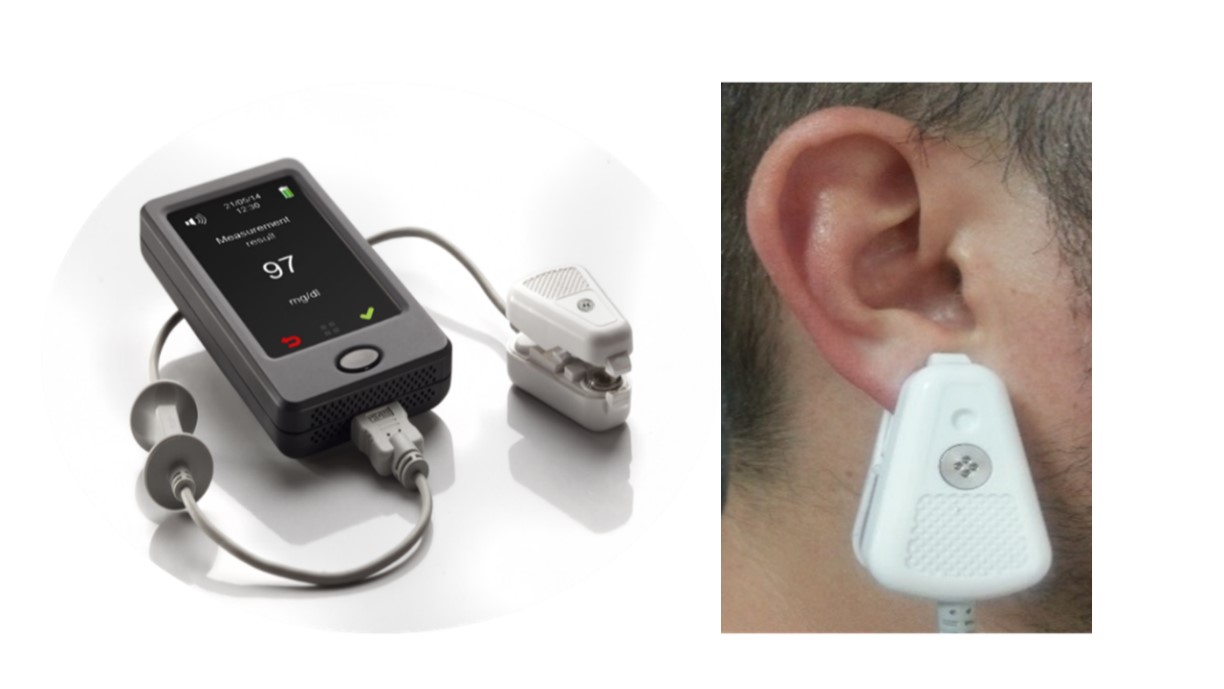
Figure 1: The device and illustrates how a measurement is performed.
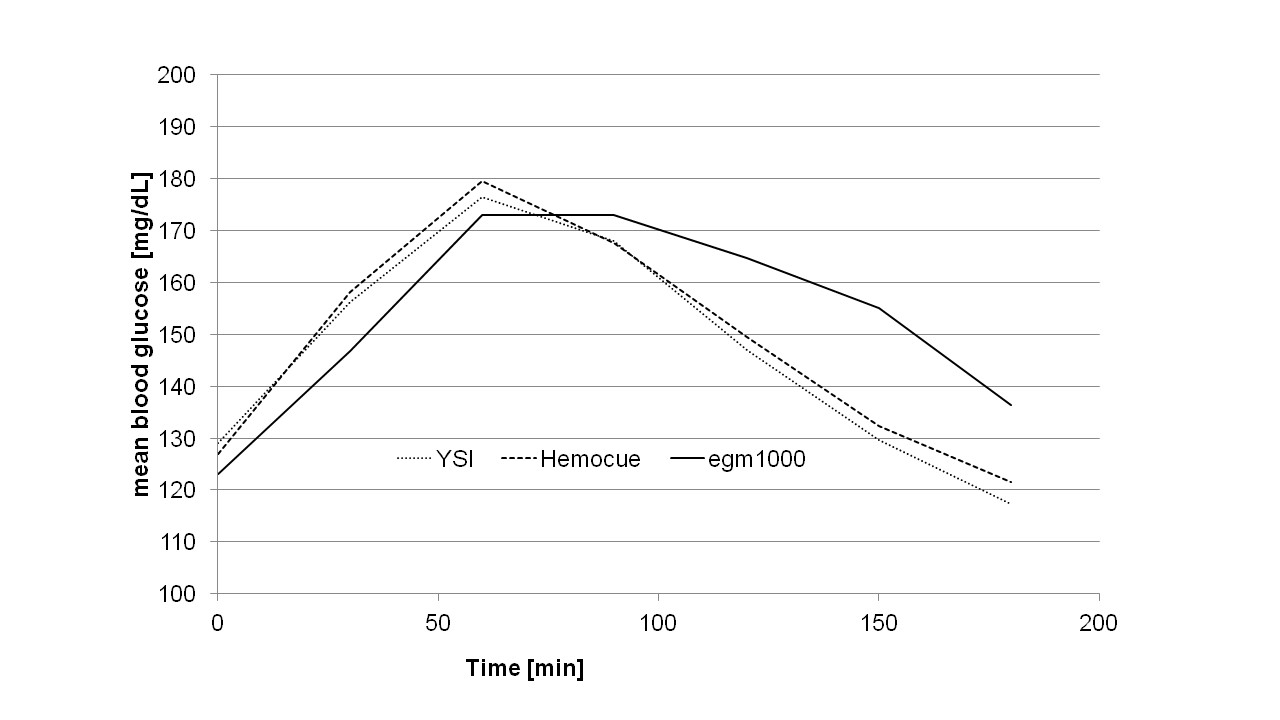
Figure 2: The mean glucose curves for the entire patient population are provided.
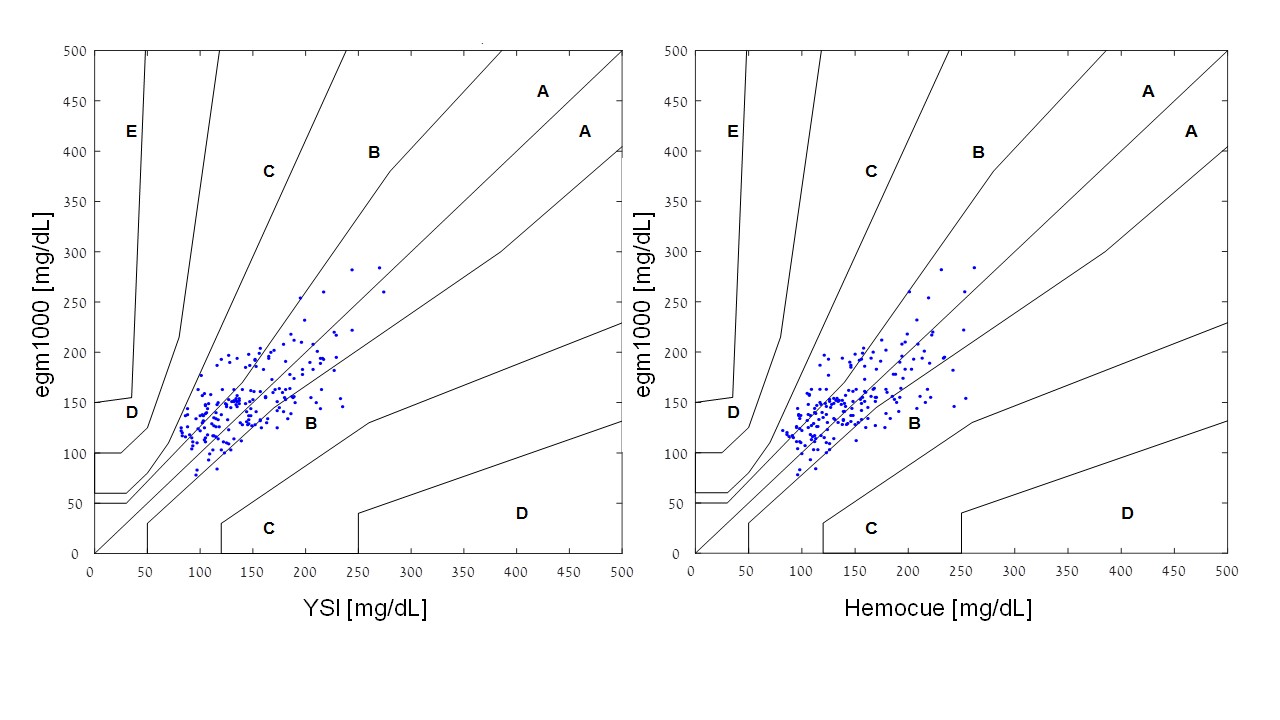
Figure 3: The two consensus error-grid plots are provided.
Citation: Pfützner A, Sachsenheimer D, Hanna MR, Lier A, Anke H (2019) Evaluation of the Non-Invasive Glucose Monitoring Device egm1000TM in Patients with Type 2 Diabetes and Subjects with Prediabetes. J Diabetes Metab Manag: JDMM-100005