
Annals of Medical & Surgical Case Reports
Research Article
Validation of Segmented Attenuation Correction (SAC) Method for Brain Imaging with Positron Emission Tomography (PET)
Fleming RM1*, Fleming MR1 and Chaudhuri TK2
1FHHI-Omnific Imaging-Camelot, USA
2Department of Radiology, Eastern Virginia Medical School, USA
*Corresponding author: Richard M. Fleming, The Camelot Foundation, Fhhi-Omnific Imaging-Camelot, USA, Email: DrRichardMFleming@gmail.com
Citation: Fleming RM, Fleming MR and Chaudhuri TK (2019), Validation of Segmented Attenuation Correction (SAC) Method for Brain Imaging with Positron Emission Tomography (PET). Ann Med & Surg Case Rep: AMSCR-1000014.
Received date: 13 August, 2019; Accepted date: 23 August, 2019; Published date: 30 August, 2019
Abstract
A previously unpublished segmented attenuation correction (SAC) technique previously validated for Positron Emission To- mography (PET) imaging of the heart has now been tested for attenuation correction in the brain. The new technique computes at- tenuation correction factors automatically from transmission images for use in the final image reconstruction.
Transmission images are first segmented into anatomical regions by thresholding the histogram of the attenuation values cor- responding to different regions; specifically bone, soft tissue, head holder and background. Average attenuation values were then ob- tained for the segmented regions and new attenuation correction factors computed by forward projecting these regions into sinograms for correction of emission images.
The technique was tested with phantom studies and with clinical brain studies in twenty-two patients both before and after smoking marijuana. The new method for attenuation correction reduced noise in the final image, reduced the attenuation scan time, and was linearly correlated (slope=1.11 and r=0.94) with the standard directly measured method.
Keywords: Brain PET; Marijuana; Marijuana impact on brain; Segmented attenuation correction
Introduction
The accuracy of data recovery from Positron Emission Tomography (PET) partially depends upon the correction for attenuation of the emitted photons within the body [1]. Failure to correct for attenuation in PET causes non-uniform detection in the brain, the severity of which depends on several factors such as the size, the shape, and the orientation of the brain. Two methods of attenuation correction (the measured and the geometrical method) in the brain are currently used [2]. The measured method derives the Attenuation Correction Factors (ACF) from a transmission scan obtained with an external radiation source outside the patient. The geometrical method computes the ACF values from regions drawn or outlined from the attenuation image obtained from the transmission data. Computed values of ACF have less noise and therefore result in less noise in the emission images. However, drawing regions requires operator intervention and its accuracy is therefore operator dependent.
A previously unpublished method for brain PET, Segmented Attenuation Correction (SAC) incorporating both measured and geometric techniques has been developed and previously validated in the heart [3]. It utilizes a priori knowledge, that a transmission image of the brain comprises muscle, fat, blood, bone, head holder and sinuses (air). Automatic region identification from transmission images is then based on the a priori knowledge identifying three easily distinguishable regions, viz. soft tissue, head holder and air, by segmenting the attenuation coefficients into three values. We refer to this approach as the Segmented Attenuation Correction (SAC) method. This study tested SAC in phantoms and clinical brain studies as described below.
Materials and Methods
Attenuation coefficient for soft tissue and bones for 511 Kev gamma photons is 0.084 per cm [4]. For a particular tissue such as muscle, the attenuation values are quite homogeneous in the body as demonstrated by X-ray Computed Tomography. The higher energy of the 511 Kev radiation combined with the low number of photons in the image makes it difficult to distinguish between soft tissue, fat and brain matter. Skull bone is marginally distinguishable from tissue in the brain for PET attenuation scans. Sinuses are significantly different in attenuation values and can be easily distinguished from soft tissue with PET. Sinuses also have little or no attenuation for the 511 Kev radiation and have been a source of error in computed elliptical attenuation correction for the brain.
Automatic detection of regions
The SAC method can automatically draw regions of interest (ROI) around the brain and air sinuses. Automatic regions were drawn in the attenuation images of the brain, using the threshold values of 50 and 139 for an image normalized to a maximum intensity of 255 [3]. The attenuation values for each of the anatomical regions were averaged and then forward projected into profiles for attenuation correction of the emission images. Reconstructed images were evaluated using both conventional and SAC attenuation correction methods.
The size of the segmented regions of the attenuation scans changed as a function of the threshold values selected and therefore the attenuation lengths computed from the segmented attenuation images also changed. This change in attenuation lengths causes a change in the ACF, which can effect the accuracy of quantitation in the heart. An under correction for attenuation results in lower recovery of activity from the center of the brain, while an over correction causes an increased recovery of activity from the center of the brain. A correct value of attenuation correction causes uniform recovery of activity from the center to the periphery of the brain [1].
Computation of new attenuation correction factors
Once the ROI are identified, average values for the attenuation coefficients measured from the transmission scan are computed for each region. These average values are then used to replace the measured values for each pixel in the image. The new values of attenuation for each pixel in the image are forward projected (the reverse of back projection) onto sinograms, which are then used to correct the emission sinograms for attenuation. Computation of new attenuation sinograms was carried out on a DEC VAX 11/780 mainframe computer and required 15 minutes of computation for each patient.
Evaluation of SAC method with a pie phantom
An eight-sector pie phantom filled with different concentra- tions of radioactivity in each sector was imaged using time-of- flight (TOF) PET [5,6] collecting nine slices simultaneously. The radionuclide concentrations for each sector were 1.0, 0.75, 0.625, 0.438, 0.25, 0.19, 0.063, and 0.0. Two attenuation scans were col- lected, one containing 15 million counts and the other 200 mil- lion counts for all nine slices. The 200 million counts is typical for attenuation scans performed for clinical cardiac or brain PET imaging. Attenuation correction factors were computed using the measured method and the SAC method. Emission images were then corrected using the measured method and the SAC method. Regions-of-interest were drawn in each sector and the mean and standard deviation of each ROI were obtained.
Evaluation of Brain SAC method with clinical studies
Twenty-two patients had thirty-minute attenuation PET scans of the brain with F-18 FDG using the TOF PET [5,6]. These study subjects were already participating in a study of the before and after effects of marijuana smoking as assessed using brain PET. A total of six ROI per slice were drawn for each patient. Five ROI’s of approximately 2.32 square centimeters were drawn for each slice including (1) the center (thalamus), (2) frontal cortex, (3) right and (4) left parietal/temporal regions, and (5) the occipital/ cerebellar region, as shown in (Figure 1). The final ROI was drawn representing (6) the entire brain. A total of one thousand one hundred and eight-eight ROI’s were analyzed by the SAC method.
Results
The results of the recovered pie phantom quantitation data, corrected for attenuation with 15 and 200 million measured counts with the SAC method is shown in Table 1. The recovered data is normalized to 100% for the highest activity, with the percent standard deviation for each sector shown in parenthesis.
Pie phantom data
Trans axial images of the Pie phantom were obtained with the measured attenuation correction and using the SAC method. The image corrected for attenuation containing 15 million counts for all nine slices was quite noisy with larger standard deviations as shown in Table 1. The image corrected for attenuation based on an attenuation scan containing 200 million counts for all nine slices, or approximately 25 million counts for the slice, showed an acceptable amount of noise, with less variance as noted in Table 1. Images corrected with the SAC method derived from the 15 and the 200 million counts attenuation scans collected over 2 minutes and 30 minutes respectively showed better image quality with less variance/standard deviation.
The SAC method showed a reduction in the noise (standard deviation) with the 15 million-count attenuation correction almost identical to the 200 million-count image. The level of noise in an image is indicated by the standard deviation of the data, which is approximately the same for a 15 million-count SAC attenuation correction as a 200 million count conventional correction. The SAC method requires significantly fewer attenuation counts to produce similar noise characteristics. A typical 15 million-count attenuation acquisition takes about 2 minutes compared to 30 minutes for a 200 million-count attenuation.
Evaluation of clinical images
Clinical images were reconstructed with the measured attenuation correction method and the SAC method for typical clinical studies with 200 million attenuation counts. Emission images corrected with the measured attenuation correction were compared with emission images corrected by the SAC method.
The two sets of clinical images were evaluated by drawing six regions of interest (Figure 1) in each slice or 54 regions for each patient. Emission images corrected with 30 minute measured attenuation correction were compared to the data obtained with the SAC method correction derived from the 30 minute measured attenuation image. The SAC corrected emission data was linearly correlated to the conventional attenuation correction data with a slope of 1.11 and a regression coefficient of 0.94.
Discussion
We have shown with phantom and clinical data that the SAC method for attenuation correction is comparable in quantitation to the measured method for attenuation correction for PET. We have also shown that shorter scan times are feasible with the brain, similar to the heart validation study. The shorter scan time has other implications for wider clinical application of PET. It can improve throughput or the number of studies completed per day, thereby making PET more economical. Shorter scan times also make it possible to image with less movement artifacts in the images, which has been a major concern in higher resolution systems.
The average attenuation coefficient measured with the transmission scan in the segmented images was used for the calculation of ACF. To simplify the SAC method even further, the average measured attenuation coefficients could be replaced by theoretical attenuation coefficient values for hypothetically better corrections, independent of the effects of random, scatter and backscattered radioactivity in the object. Using the theoretical attenuation correction coefficients, it is possible to use the SAC method in the presence of radioactivity already in the tissue. The attenuation scan could be obtained following the injection of a long life tracer such as F-18 FDG after the emission images are collected.
An example of a patient in whom the attenuation scan was carried out 60 minutes after the injection of 8-mCi of F-18 FDG was compared. The emission image was started 45 minutes after the injection and lasted 15 minutes. Two attenuation scans were carried out; one before the injection of radioactivity and another after the emission scan. The presence of radioactivity in the brain caused a lowering of the ACF values everywhere except the skull where there was very little radioactivity. The boundary of the brain is easily detected from the outline of the skull and theoretical attenuation coefficients can be used inside the region of the brain. The total scan time for an F-18 FDG brain scan by PET can be reduced using this technique to less than 25 minutes, thus increasing the throughput and minimizing the possibility of motion artifacts.
Conclusion
These results show that the previously validated SAC method for cardiac imaging can also be applied to brain imaging. The SAC method for attenuation correction of PET scans can shorten the attenuation scan time and maintain the same or better quantitation in comparison with directly measured attenuation corrections. Further testing of the SAC method should be carried out for the measurement of attenuation correction factors in the presence of radioactivity in the brain.
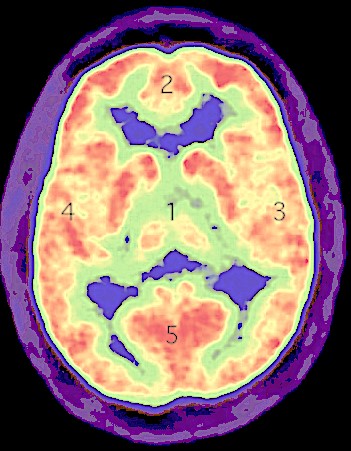
Figure 1: Six regions-of-interest were drawn for each slice of acquired brain positron emission tomography acquisitions.
|
Pie Sector |
Measured [15 M] |
Measured [200 M] |
SAC [15 M] |
SAC [200 M] |
|
0 |
100 (5.0) |
100 (1.1) |
100 (1.9) |
100 (1.4) |
|
1 |
93.0 (7.3) |
77.3 (1.9) |
80.3 (2.3) |
79.4 (2.8) |
|
2 |
71.6 (4.9) |
66.2 (2.5) |
66.0 (1.8) |
65.5 (1.3) |
|
3 |
57.6 (6.8) |
50.7 (4.6) |
49.0 (1.6) |
48.2 (1.7) |
|
4 |
29.2 (11.3) |
28.4 (2.5) |
29.5 (2.0) |
29.0 (2.5) |
|
5 |
22.5 (15.1) |
22.2 (4.9) |
22.5 (4.4) |
21.8 (3.8) |
|
6 |
8.4 (50.1) |
8.2 (17.5) |
7.9 (6.5) |
7.8 (6.9) |
|
7 |
3.0 (93.2) |
2.6 (22.4) |
1.9 (35.7) |
1.8 (39.1) |
Table 1: Recovered Pie phantom quantitation corrected for attenuation with 15 and 200 million measured counts with the previously unpublished SAC method. Each sector of the Pie phantom was filled with varying concentrations of radioactivity. The recovered data is normalized to 100% for the highest activity. The % standard deviation for each sector is shown in parenthesis.
Citation: Fleming RM, Fleming MR and Chaudhuri TK (2019), Validation of Segmented Attenuation Correction (SAC) Method for Brain Imaging with Positron Emission Tomography (PET). Ann Med & Surg Case Rep: AMSCR-1000014.