
Open Access Journal of Agriculture Research (ISSN 2651-9003)
Technical Efficiency of Smallholder Teff Production
Nigusu Abera*
Selale University, Fiche, Ethiopia
*Corresponding author: Nigusu Abera, Selale University, Fiche, Ethiopia, Tel: +251925582670.
Citation: Abera N (2019) Technical Efficiency of Smallholder Teff Production. Open Acc J Agri Res: OAJAR-100015.
Received Date: 19 March, 2019; Accepted Date: 02 April, 2019; Published Date: 09 April, 2019
Abstract
A policy maker interest might lie on both knowing how far a given farm could increase its output without using further resources through improvement of efficiency and also identification of significant variables affecting efficiency for intervention. The objective of this study was to estimate the levels of technical efficiencies of smallholder teff production and identify factors affecting it in Debra Libanos district, Oromia National Regional State, Ethiopia. A two-stage sampling technique was used to select 246 sample farmers to collect primary data pertaining to 2016/17 production year. Parametric stochastic production frontier model was used to estimate the level of TE in teff production while two limit Tobit regressions model was used to estimate factors affecting technical efficiency. The estimated result of the frontier model indicates that seed and land size had a positive and significant effect on teff production in the study area. The mean technical efficiencies of sample households were 79 indicating the existence of technical inefficiency in teff production. A two-limit Tobit model results indicate that technical efficiency was positively and significantly affected by the gender of the household head, education level of household head and participation in off/non-farm activities but negatively affected by farm size. The policy measures derived from the results include expansion of education facilities and strengthening the existing off/non-farm activities in the study area.
Keywords: Technical efficiency; Stochastic frontier; Tobit model
Introduction
Ethiopia is one of the Sub-Saharan African countries which liberalized its economy to maintain sustained economic growth and reduce poverty [1]. Agriculture is the most important sector for sustaining growth and reducing poverty in Ethiopia. It accounts for 80% of employment, 90% of foreign exchange earnings and 38.8% of gross domestic product [2]. In spite of its huge economic contribution; the sector is dominated by subsistence, small-scale and resource poor farmers. Moreover, lack of adequate farm management practices, low level of modern inputs use, the depletion of soil organic matter and rain-fed agriculture system are major obstacles to sustain agricultural production in the country [3,4]. Out of the total grain crop area, 79.9% (about 9,974,316.3 hectares) were under cereals. Among this teff took up 23% of the grain crop area and 16.8% of cereal production [5]. It is the dominant cereal by area planted and second only to maize in production and consumption [6]. Teff production has its own recommended rates of chemical fertilizer, seed, management practices such as plowing and weeding among others. However, there is little adoption rate by farmers and have brought greater impact on teff production [7]. This holds true for the district in which the study was undertaken. Debra Libanos district is the area where teff was dominantly produced and consumed. Despite the increase in area and production, its productivity is low (14.2qt/ha) which is below the average of national yield (15.6qt/ha) and zone (16.6qt/ha) indicating poor productivity. There was also variation of productivity among teff producer farmers in the districts due to a difference in inputs application rate and poor management practices like timely weeding and sowing. Therefore, these studies measure the level of efficiency and identify factors affecting it among smallholder teff producers in the study area.
Statement of the Problem
Teff is a highly valuable grain for the Ethiopian people both in quantity produced and consumption level. However, its average productivity was low in the country. An increase in teff production has mainly come from expanding the amount of land under cultivation which is a limited resource in Ethiopia [8].Therefore, due emphasis should be given to how to use the limited resource to increase production and productivity of crop in Ethiopia. One method of increasing productivity is by improving the level of efficiency. The empirical studies on the efficiency of smallholder teff production in Ethiopia revealed that there is room to improve the efficiency of farmers with the current resource existed at hand rather than creating new technology [9,10]. However, there was no study conducted before to measure the level of efficiency in teff production and factors affecting it in the study area. Therefore, this study aims to fill the above noticeable gaps of knowledge by collecting cross-sectional data from teff producer farmers in the study area.
Research Methodology
Description of the Study Area
The study was conducted at Debra Libanos district, which is found in North Shoa (Selale) zone of Oromia National Regional State. It is located at 89 km north of capital Addis Ababa and between 38o 58’ 33”E longitude and 9o 63’75’’N latitude. The altitude ranges from 1500 to 2700 meter above sea level. The maximum and minimum average annual temperature is 230C and 150C, respectively. Its main rainy season occurs between May and September and the dry season lasts from October to April. The average rainfall was ranging from 800 to 1200 mm per annum. Derba Libanos district consists of 60% Dega (highland), 30% Weinadega (mid-highland) and 10% Kola (lowland) (Figure 1).
Sampling Technique and Sample Size Determination
Two-stage random sampling techniques were employed to draw a representative sample. In the first stage, three teff producing kebeles were randomly selected since all kebeles were engaged in teff production. In the second stage, probability proportional to sample size was employed to select sample farmers. Accordingly, 246 households were randomly selected for interview. The sample size was determined by using the formula given by Yemane (1967) [11] as follow:
Types and method of data collection
Both primary and secondary data were used in this study. Primary data were collected from sampled household based on the actual farming practices existed in the study area. Secondary data was collected from woreda agricultural office, published thesis and dissertation. In this study field observation, focus group discussion and structured questionnaire were used to collect the data.
Method of data analysis
Both descriptive and econometric methods were used to analyze the data. Descriptive statistics like mean, percentage, frequency, and standard deviation were used to analyze the demographic and socio-economic characteristics of the sample farmers. Econometric model like Cobb-Douglas stochastic production frontier model was used to predict the efficiency scores of sample farmers and two limits Tobit model was used to analyze the determinants of technical efficiency.
Econometric model specification
Most empirical studies on technical efficiency in Ethiopia were analyzed using Cobb-Douglas stochastic production frontier model [10,12-14]. The main reason is that the stochastic approach allows for statistical noise such as measurement error and climate change which are beyond the control of the decision-making unit.
Following Aigner et al. (1977) [15] the model was specified as follows:
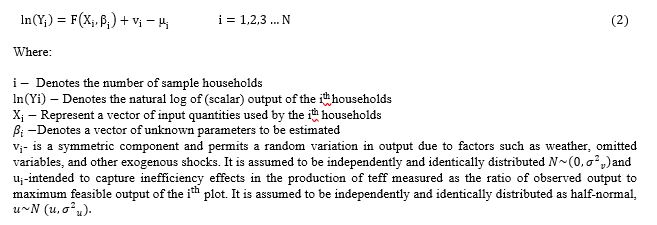
After specification of the model, the next step will be the estimation of TE for individual farmers. Using the above specified Cobb-Douglas production function in equation (2), estimation of TE for individual firms is predicted by obtaining the ratio of the observed production values to the corresponding estimated frontier values. Accordingly, the study computes TE for the ith firms as:
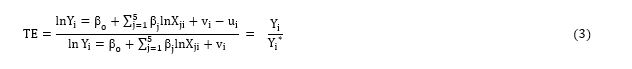
This value lies between zero and one implying fully technically inefficient and fully technically efficient respectively.
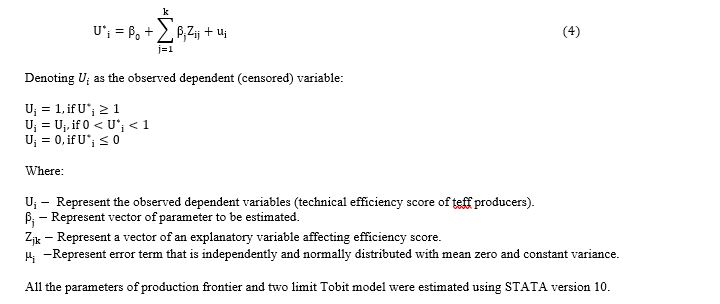
To analyze the effect of demographic, socioeconomic, farm attributes, marketing and institutional factors on technical efficiencies, two- limit Tobit regression model was used where the efficiency scores are regressed on selected explanatory variables. This model is best suited for such analysis because of the nature of the dependent variable (technical efficiency scores), which takes values between 0 and 1 and yield the consistent estimates for unknown parameter vector [16]. Following [17] the two-limit Tobit regression model can be specified as:
Results and Discussion
Result of descriptive analysis
On average sample, farmers produced 10.6 quintal of teff, which is the dependent variable in the production function. In addition, the average amount of chemical fertilizer used by sample farmers were 248.4kg which was the highest share relative other inputs. Furthermore, on average about 36.4kg of seed was used by sample farmers on 1.3ha of land. The total pair of oxen and labor used for teff production was on average, 18.8 and 86.5 respectively (Table 1).
Statistical summary of variables used in determinant of technical efficiency
According to the survey result, the average age of household heads was 52.7 year with a range of 30 to 89 years and standard deviation of 12.4. Furthermore, family members including household head are the major sources of labor for crop production in the study area. Accordingly, family size ranges from 1.8 to 8.9 with mean and standard deviation of 4.9 and 1.4 respectively. In the study area, about 86.2% of household heads were male and 13.8% were females. Education is an instrument to enhance the quality of labor by improving the managerial skill and the tendency to adopt new technologies. According to the survey result, the average education levels of sample farmers were grade one ranging from 0 to grade 9. In addition, off/non-farm activities are the source of income for rural community besides farm income. The income they desperately need to obtain from such off/non-farm activities may substantiate the low income that is usually obtained from farming activities. According to the survey results, about 72.8% of the sample households participate in off/non-farm activities (Table 2).
Result of econometrics analysis
The maximum likelihood estimation (MLE) of the parametric stochastic production function
The model consists of five explanatory variables hypothesized to affect teff production in the study area. These are seed, land, labor, chemical fertilizer and oxen power. Among the five input variables considered in the production function, only two variables (land and seed), had a positive and significant effect in determining the variation of teff output among sample farmers. The elasticity of production with regard to seed use was 0.4291 which implies that holding all other inputs constant, a 1% increase in the quantity of teff seed, results in 0.43% increase in teff output. This result is consistent with the finding of Ermias (2013) [18]; Sisay et al. (2015) [14]. Similarly, the land had a significant effect on teff production with elasticity of 0.6305 at 1% significance level. This implies a 1% increase in the quantity of land allotted for teff would increase teff output by 0.63%. This result is in line with the finding of Hailemaraim (2015); Sisay et al. (2015) [10,14]. In addition, the estimated value of gamma (γ) is 0.60. This implies that about 60% of the total variation in teff output was due to technical inefficiency while the remaining 40% variation in teff output resulted from random error, which is due to factors outside farmer’s control (Table 3).
Efficiency scores and distribution of sample farmers
The average TE of sample farmers was about 0.79 with a minimum level of 0.41 and the maximum level of 0.92. This means that if the average farmer in the sample was to achieve the technical efficiency level of its most efficient counterpart, then the average farmer could realize a 21% increase in output by improving technical efficiency with existing inputs and technology. The higher distributions of the TE level classes were 0.81 to 0.90 which cover 49.19% of the total sample. Out of the total sample households, only 2.43% had TE greater than 90%. This implies that about 97.57% of the households can increase their production at least by 10% (Table 4).
Determinants of technical efficiency
The gender of households head had a positive and significant effect on technical efficiencies at 1% significant implying that male-headed households are more likely to be technically efficient compared to their female-headed counterpart. This is because male-headed households might be more likely to attend different training, follow up of the farm and access to information than female-headed households. Furthermore, the result indicates, a change in the dummy variable sex (from 0 to 1) increases the expected value of technical efficiency of farmers by 7.2%. This result is consistent with the finding of Mekdes (2011) [19]. The study also reveals a positive and significant association between education level and technical efficiency at 5%, implying that farmers with a higher level of education are more efficient than others. The reason might be educated farmers are better access to information and could quickly adopt new technologies on their farm. In other words, the result shows, a one year increase in the education level of a household head increases the expected value of technical efficiency of a farmer by about 0.7%. This result is consistent with the finding of Solomon (2014); Hailemaraim (2015) and Sisay et al. (2015) [10,13,14]. The study also found that participation in the off/non-farm activities had a positive and significant effect on technical and economic efficiencies as expected at 10% level of significance. This implies that farmers who participate in off/non-farm activities are more efficient than non-participants. This might be because income obtained from such activities could be used for the purchase of agricultural inputs and augment financing household’s expenditures which would otherwise put pressure on farm income. Furthermore, the result indicates a change in the dummy variable off/non-farm activities (from 0 to 1) increase the expected value of technical efficiency of farmers by 2.6%. The result is consistent with study of Ermias (2013) and Hailemaraim (2015) [10,18]. Farm size had a negative and significant effect on technical efficiency as expected at 10% significance level respectively. This means that as land holding of the farmers increase, technical efficiency decrease. This is because of its difficulty in management and higher transaction cost compared to the small farm size. In other words, a unit increases in farm size of households decrease the expected value of technical efficiency of a farmer by 0.6%. This result is in line with the finding of Mekdes (2011) and Sisay et al. (2015) [14,19] (Table 5).
Conclusion
The study established that smallholder farmers are resource use inefficient in the production of teff with mean efficiency levels of 0.79. This implies that there exists a considerable room to enhance the level of technical efficiency of teff producer farmers. Accordingly, farmers can increase their teff production on average by 21% if they were technically efficient. The result of the production function indicated that land and seed had positive coefficients 0.63 and 0.43 respectively. This implies that increasing the use of these inputs by one unit would increase the production by 0.63 and 0.43 respectively. The factors that affect the level of efficiency were identified to help different stakeholders to enhance the current level of efficiency in teff production. Accordingly, sex, education, participation in off/non-farm activities had a positive and significant effect on technical efficiency. This implies that male-headed households, higher educated farmers and farmers participating in off/non-farm activities were more technically efficient than their counterparts respectively. However, farm size had a negative and significant effect on technical efficiency implying that farmer with large farm sizes was less technically efficient than their counterparts.
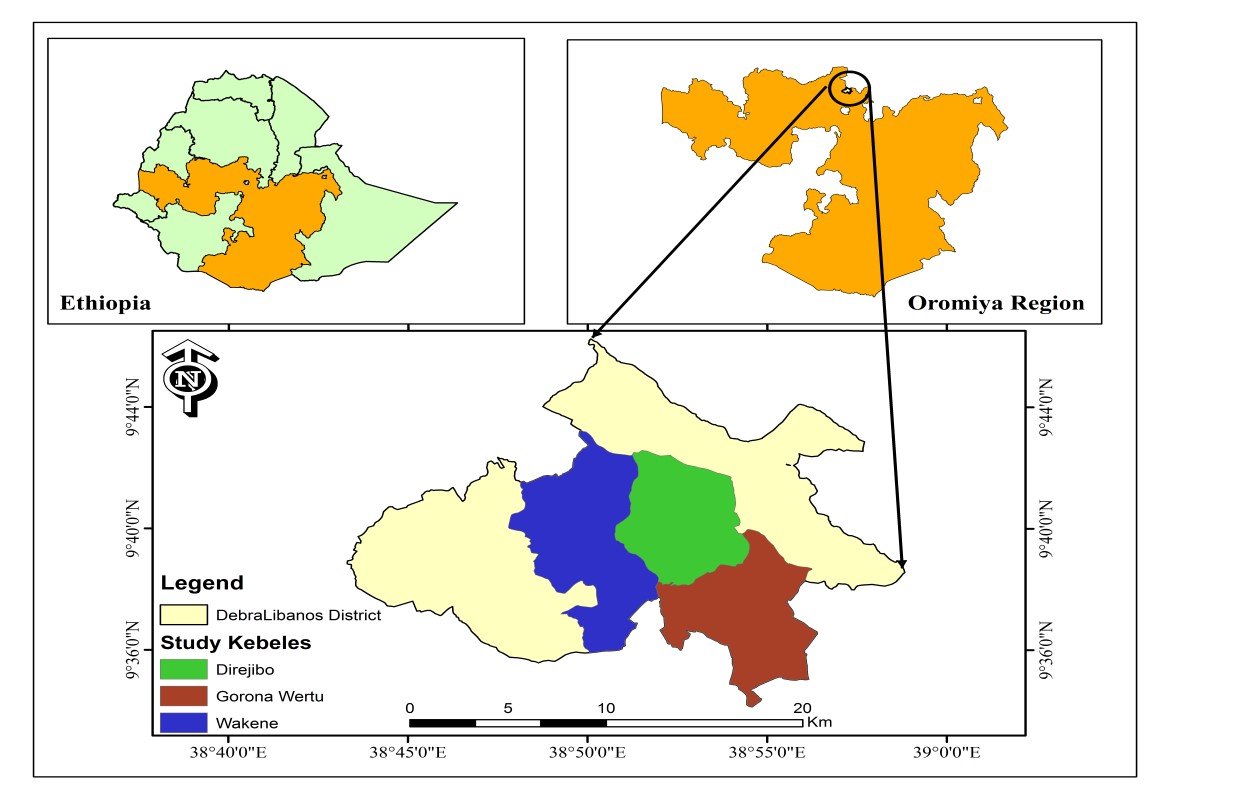
Figure 1: Map of the study area.
|
Description |
Minimum |
Maximum |
Mean |
Std. dev. |
|
Output (Qt) |
1 |
49 |
10.6 |
7.2 |
|
Chemical fertilizers (Kg) |
50 |
1,000 |
248.4 |
134 |
|
Seed (Kg) |
7 |
152 |
36.4 |
21 |
|
Oxen (Oxen day) |
5 |
76 |
18.8 |
10.3 |
|
Land (Ha) |
0.25 |
5 |
1.3 |
0.7 |
|
Labor (ME) |
11 |
300 |
86.5 |
46.9 |
|
Source: Survey result (2017) |
||||
Table 1: Summary statistics of variables used to estimate the production function.
|
Description |
Mean |
Std. dev. |
Percentage with dummy=1 |
Percentage with dummy=0 |
|
Age |
52.7 |
12.4 |
- |
- |
|
Family size |
4.9 |
1.4 |
- |
- |
|
Education |
1.4 |
2.1 |
- |
- |
|
Livestock size |
8.23 |
4.41 |
- |
- |
|
Extension contact |
8.1 |
2.9 |
- |
- |
|
Frequency of weeding |
1.4 |
0.5 |
- |
- |
|
Frequency of plowing |
4.2 |
0.7 |
- |
- |
|
Distance of plot from home |
21.8 |
10.9 |
- |
- |
|
Distance from nearest market |
39.1 |
16.4 |
- |
- |
|
Sex of household head |
- |
- |
86.2 |
13.8 |
|
Off/non-farm activities |
- |
- |
72.8 |
27.2 |
|
Access to credit |
- |
- |
80.9 |
19.1 |
|
Plot fertility |
- |
- |
63.8 |
36.2 |
|
Source: survey result (2017) |
||||
Table 2: Summary of variables used in determinant of technical efficiency.
|
|
MLE |
|
|
Variables Parameter |
Coefficient |
Std. Err. P>|Z| |
|
Intercept βo |
0.5218 |
0.3147 0.097 |
|
Seed β1 |
0.4291*** |
0.0607 0.000 |
|
Land β2 |
0.6305*** |
0.0831 0.000 |
|
Labor β3 |
-0.0216 |
0.0574 0.707 |
|
Fertilizer β4 |
0.0704 |
0.0523 0.178 |
|
Oxen β5 |
0.0192 |
0.0711 0.787 |
|
Variance parameters: |
|
|
|
σ2=σv2+σu2 |
0.16 |
|
|
λ=σu/σv |
1.22 |
|
|
Gamma (γ) |
0.60 |
|
|
Log likelihood |
-64.34 |
|
|
Note: *** refers to 1% significance level. Source: Model output (2017) |
||
Table 3: MLE results of the production frontier for the sample farmers.
|
Efficiency |
Frequency |
Percentage |
|
range |
||
|
<0.40 |
0 |
0 |
|
0.41-0.50 |
1 |
0.41 |
|
0.51-0.60 |
8 |
3.25 |
|
0.61-0.70 |
26 |
10.57 |
|
0.71-0.80 |
84 |
34.15 |
|
0.81-0.90 |
121 |
49.19 |
|
0.91-1.00 |
6 |
2.43 |
|
Total |
246 |
100 |
|
Source: Own computation (2017) |
||
Table 4: Frequency distribution of TE.
|
Variables |
Marginal Effect |
Standard Error |
|
Constant |
0.6989*** |
0.0358 |
|
Sex of household head |
0.0728*** |
0.0114 |
|
Education level of household head |
0.0071** |
0.0024 |
|
Participation in off/non-farm activities |
0.0264* |
0.0103 |
|
Farm size |
-0.0069* |
0.0028 |
|
***, ** and * indicate the level of significance at 1, 5 and 10%, respectively. Source: Model output (2017) |
||
Table 5: Two limit Tobit regression estimates of technical efficiency.
Citation: Abera N (2019) Technical Efficiency of Smallholder Teff Production. Open Acc J Agri Res: OAJAR-100015.