Annals of Medical & Surgical Case Reports
Stabilization of Molecular Structure Membranes of Preserved Rbcs by Means Nanotechnology
Andrey Belousov1,2,3*, Elena Malygon2,3, Vadim Yavorskiy2,3 and Ekateryna Belousova1
1Laboratory of Applied Nanotechnology of Belousov (UA)
2Kharkov Medical Academy of Postgraduate Education (UA)
3Kharkov Regional Center of Blood Service (UA)
*Corresponding author: Andrey Belousov, professor of anesthesiologist and resuscitator, Laboratory of applied nanotechnology of Belousov, Ukraine Tel: +380509151889.
Citation: Belousov A, Malygon E, Yavorskiy V, Belousova E (2019) Stabilization of Molecular Structure Membranes of Preserved Rbcs by Means Nanotechnology. Ann Med & Surg Case Rep: AMSCR: 100001.
Received date: 28 January, 2019; Accepted Date: 06 February, 2019; Published Date: 13 February, 2019
1. Abstract
This study was devoted to the learning changes in the structure of erythrocyte membranes at the level of molecular bonds during their storage at a positive temperature by means method of infrared spectroscopy (IR). Objects of research were red blood cells (RBCs) into bags containing preservative CPD and RBCs into bags containing preservative CPDA-1. As membrane protective used saline which had previously been treated with magnetite nanoparticles (ICNB) by the Belousov's method. The physiological solution that was treated with nanoparticles was added to the preserved RBCs according to the developed method. Sample of control was the addition of intact saline. Analysis of changes occurring in the IR spectra of control and test samples in different variants of preservative media showed that in the test where nanotechnology was used were significant inhibit the process of destruction of the erythrocyte membrane structure in suspensions. The process of destruction of the membrane structure of red blood cells occurs on seven days later than in the control. In addition, in the test in the CPDA-1 medium in comparison with control there is no complete destruction of the structure of lipids and proteins that are part of RBCs. In general, the results clearly showed that the presented method of application of nanotechnology significantly increases the storage time of RBCs in different versions of preservatives due to mechanisms to reduce violations of the molecular structure of proteins and lipids in the erythrocyte membranes. Presented method of application of nanotechnology is not only safe for use in practice in the Blood Service, Transfusiology and Hematology, but also is the most promising innovation project.
In general, the results clearly showed that the presented method of application of nanotechnology significantly increases the storage time of RBCs in different versions of preservatives due to mechanisms to reduce violations of the molecular structure of proteins and lipids in the erythrocyte membranes. Presented method of application of nanotechnology is not only safe for use in practice in the Blood Service, Transfusiology and Hematology, but also is the most promising innovation project.
2. Keywords: Magnetite nanoparticles (ICNB); Method of infrared spectroscopy (IR); Molecular structure; Nanotechnology; Preserved red blood cells (RBCs); Storage time of RBCs
3. Actuality
For a long time RBCs components have been prepared as concentrates. The concentrates of RBCS are suspended in nutrient additive solution. This preserves and extends the shelf-life of their, allowing up to 6-7 weeks of refrigerated storage [1]. In during storage RBCs undergo progressive accumulation of physicochemical changes [2,3]. At now, clinical studies have identified that RBCs transfusion is risk factor for increased morbidities and mortalities in certain groups of patients reviewed in [4-6]. Some of these studies have shown that transfusion of older preserved RBC causes more complications in patients [6]. To address these problems, there is renewed interest in finding ways to mitigate the adverse effects of blood storage. This will improve the quality, efficiency and safety of RBC components. Nevertheless, slower progress is being made in finding ways to deter the detrimental effects of the RBCs storage lesion [7].
Despite the RBCs having been a favorite experimental model for cellular biologists and biochemists, RBCs storage research has repeatedly demonstrated that a lot of fundamental biology about RBCs is still not well understood. The complexity of the inter-relationship between RBCs biochemistry, cytoskeletal structure and membrane properties have made it difficult to predict how RBCs will respond to different storage conditions. Exposure of RBCs to non-physiological storage environments has pointed to the existence of previously unknown biochemical mechanisms in RBCs, including apoptotic-like processes, ion and osmotic channels that behave differently than expected, exposure of new or altered receptors possibly due to oxidative and/or protease/glycosidase activities or altered senescence [8-11].
The advantages obtained by improving the quality of RBC components more than justify any real or perceived inconvenience associated with the adjustment of their processing procedures or additional processing costs due to the introduction of new generation RBCs additive solutions.
Currently, nanotechnology opens up new prospects for the study of not only the mechanisms of cell damage, but also the development of effective and safe methods of cells storage outside the body.
In Ukraine, the first biocompatible magnetite nanoparticles for medical use were manufactured and patented by Andrey N. Belousov in 1998. These are intracorporeal nanobiocorrector (ICNB), magnet-controlled sorbent (MCS-B), and biologically active nanodevice (Micromage-B) [12].
It was found that magnetite nanoparticles regulated the activity of the enzyme link of the antioxidant system in red blood cells, effectively modulate metabolic processes in leukocytes in healthy and sick patients [13-15]. Previously the complex investigations were demonstrated that in whole standardized biocompatibility of magnetite nanoparticles have nonspecific and modulated effect on metabolic processes. Study of ultrastructure of the reticuloendothelial system (lungs, liver and kidneys) it was proved that after injection of biocompatibility magnetite nanoparticles caused nonspecific activation of the metabolic processes, increase potential of organelle cells and adaptive mechanisms, acceleration of reparative processes a level of macromolecules and membranes [14,16,17]. Sorption and magnetic properties of magnetite nanoparticles not only allow selectively absorb the protein of surface membrane cells by (according to the principle of magnetophoresis) but also to prevent the oxidative modification of proteins by way of stabilizing the active groups, normalizing a state of receptors that are located on the surface membrane of cells, increasing activity of enzymes' membrane-bound [18-20].
In an experiment it is shown on rats, that biocompatible standardized nanoparticles of ICNB can be effectively used at MRI.On the mechanism of action the nanoparticles of ICNB cause the convertible changes which is reason for the temporal increase of mobility of protons of hydrogen in near cell liquid. It inevitably modifies the metabolic process in malignant cells that in perspective has hope in elaborating new ways of the target therapy of malignant neoplasm [21]. The results of these researches have not only expanded the understanding of the mechanisms of effect of magnetite nanoparticles on condition outside and intracellular spaces but also have opened up new aspects of the cellular metabolism, determined the membrane role of cellular enzymes in the regulation processes of metabolism [19,22-24].
Also, it was established that extracorporeally pretreatment the blood by nanoparticles of MCS-B reliably (p<0.001) reduces activity of Ca, Mg - ATPHese of erythrocytes.
Now, researches have shown that magnetite nanoparticles actively to inhibit hemolysis of heparinized blood, increase the activity of ATP and 2.3 DPH in RBCs, regulate transmembrane metabolism and inhibit eryptosis [19,25,26].
In our last researches, it has been found that saline which previously was processed by magnetite of nanoparticles (ICNB) and added to the preserved of the RBCs actively inhibits of hemolysis processes of RBCs at the storage stages at a positive temperature (Figure 1). It was established reliably that saline, which had previously been treated by magnetite nanoparticles (ICNB) had a marked membrane-stabilizing effect, inhibits hemolysis and increasing the sedimentation stability of preserved RBCs. In General, these effects provide the sustainability of the functional activity of preserved RBCs in during storage. The optimization results were obtained in creating a simple and practical new method of modernization of preservation solutions which improved the quality, efficiency, safety transfusion of preserved RBCs [27-29].
However, comprehensive analysis of the above data revealed only the primary mechanisms of the effect modernized of the saline solution on the preserved RBCs. Taking this into account, it was decided to conduct an in-depth study of changes in the structure of erythrocyte membranes at the level of molecular bonds during their storage. One of the effective methods of these studies is the method of infrared spectroscopy (IR) [30].
Infrared spectroscopy (IR) is a method of identifying and analyzing chemical compounds. An infrared beam is directed at a sample, and by measuring the radiation which is absorbed by the sample at different frequencies, one can tell what kind of molecules form the sample [31,32]. The method is based on the phenomenon of absorption of electromagnetic radiation in the infrared range by groups of atoms of the object under study. When the molecule is irradiated with infrared radiation, quanta are absorbed, the frequencies of which correspond to the frequencies of valence, deformation and libration vibrations of molecules. IR allows us to trace the changes in all the main types of bonds in the molecules of the substances under study [33-36].The spectrum is displayed with a graph that shows at which frequency and how much absorption occurred. Because different molecules absorb the radiation at specific frequencies in known amounts, the spectrum can be used to identify the sample at a molecular level. Infrared spectroscopy (IR) is used in study to do quantitative analysis, recognize samples or detect impurities. IR can be used on gaseous, liquid or solid samples and does not destroy the sample in the process. IR is widely applicated for the analysis of biological fluids, in particular blood and its components [37].
Thus, the next purpose of research was the study of changes in the molecular structure of erythrocyte membranes in additive modernization of preservation solutions of RBCs at the storage stages at a positive temperature.
4. Materials and Methods
4.1. Materials: 1. Standardized intracorporealnanobiocorrector of ICNB was taken as magnetite nanoparticles. Magnetite nanoparticles synthesized by co-precipitation method. The main physics and chemical properties of ICNB the following data and also in (Tables 1-4); (Figures 2,3) were presented:
4.2. Objects of research:
Thus, the distribution of tubes was as the follows:
Tubes of control:
Tubes of test:
IR Spectrophotometer-29 (LOMO), working in NSC Kharkov Institute of Physics and Technology of the National Academy of Sciences of Ukraine, was used for registration of absorption spectra of an aqueous solution of erythrocytes in the IR range. The spectra were recorded in the range of 4000-400 cm-1 (from 2 to 25 m km - middle infrared region).
Calibration was carried out on the spectrum of polystyrene with known frequencies of absorption maxima. The amendment amounted to an average of 10-5 cm-1.
Liquid water is characterized by strong absorption in the study range, so to record the spectra of aqueous solutions is necessary to obtain a thin layer of the substance. For this purpose, two thin plates of CaF2 material transparent in the mid-IR range that does not have its own characteristic absorption bands, which could affect the interpretation of the IR spectrum of the aquatic solution, were used. A drop of the test liquid was crushed between two round plates CaF2 and installed in the measuring channel of the device. The same plates were installed in the comparison channel, but without liquid. Spectral recording was carried out immediately after placing the sample in the device and lasted 10 minutes. The temperature in the chamber was 25-30°C.
Tests were carried out in eight stages: day 1 - I, day 7 - II, day 14 - III, day 21 - IV, day 28 - V, day 35 – VI, day 42 – VII, day 49 - VIII.
The blood after performance of the biochemical investigation was stored in the refrigerating chamber at temperature +4º?.
Statistically processing the obtained results was carried out by parametrical method of variation statistics by Student criterion. Processing the obtained data was carried out by means of Excel.
5. Results and Discussion
IR absorption spectra at the initial stage of the study of RBCs suspensions in the control and test in ranges 400-1300 cm-1 and 1200-4000 cm-1 are shown in (Figures 4, 5).
Since the basis of the studied suspensions of RBCs is liquid water, the most intense and broad bands of the spectrum correspond to different types of vibrations of molecules H2O:
In addition, the spectrum has a number of bands corresponding to the preservative for RBCs, which is contained in saline:
Thus, three characteristic peaks can be distinguished in the spectrum, which are directly related to intramolecular fluctuations in the structure of erythrocytes: 1290, 1450 and 1550 cm-1 (Figure 5). Identification of absorption bands in the IR spectra of the initial RBCs suspension is presented in the (Table 5).
The spectral range in which the characteristic bands corresponding to the main fragments of the structure of RBCs are presented in Figure 6 and Figure 7
These bands can be identified as follows: Experiment 1 (preservative CPD)
A sample of control of the RBCs suspension in preservative CPD with intact saline solution on five stages of the study is presented in the Fig. 4. The peak of weak intensity of 1290 cm-1 can be attributed to fluctuations in the ring structure of the protein, as well as Amide III [37]. The weak peak of 1450 cm-1 refers to the deformation vibrations d(CH3) in the structure of lipids and proteins [38,39]. Sharp band of average intensity at 1550 cm-1 caused by valence vibrations of n (N-H)+n (C-N) Amide II [37]. Fig. 3 shows that after a week (stage II) of sample exposure the intensity of all these peaks associated with C-N valence vibrations and N-H deformation vibrations (1290, 1450 and 1550 cm-1) is decreases. This may indicate the beginning of changes in the secondary structure of the protein. After two weeks (stage III), the band 1290 cm-1 is shifted towards high frequencies (®1300 cm-1) and turns into a small bend, the band 1450 cm-1 becomes barely noticeable shoulder, and the most intense peak of Amide II in the region of 1550 cm-1 is significantly weakened.
These changes indicate the degradation of the molecular structure of the substance and the weakening of intra - and intermolecular bonds. After three weeks of storage (stage IV) in the control IR spectrum completely smoothed, disappear all the bands of red blood cells, there is a wide band of blurred vibrations in the range of O-H (1650-1500cm-1). After four weeks of storage (stage V) changes in the spectrum are not observed. Given the latter, study of IR absorption spectra was impractical in the next planned stages (stages VI, VII).
A sample of test of the RBCs suspension in preservative CPD with saline solution that previously was processed by ICNB is presented in the Figure 6.
The IR spectrum of erythrocyte suspension in the sample of test at the stage I is almost identical to the spectrum in the control, except that instead of the doublet 1290-1260 cm-1 there is a band 1300 cm-1 with a barely noticeable shoulder 1240 cm-1 (Figure 7). Over the next two weeks, no noticeable changes in the spectrum that would indicate disturbance of the molecular structure of RBCs were observed.
The intensity of the bands in zone 1300 and 1550 cm-1 are decreases, and the band 1450 cm-1 completely disappears on 21th day (stage IV) storage of RBCs. These changes indicate that the molecular structure of proteins and lipids of erythrocyte membranes begins to deteriorate. Hardly noticeable excesses associated with intramolecular vibrational against the background of water and bands preservative solution in the IR spectrum in during storage of RBCs appear only on the 28th day (stage V) of observation. Thus, the molecular structure of RBCs is not completely destroyed.
Summary of experiment 1
Analysis of changes occurring in the IR spectra of samples of control and test in the CPD medium was showed that during the first 28 days storage of:
Experiment 2 (preservative CPDA-1).
A sample of control of the RBCs suspension in preservative CPDA-1 with intact saline solution on main stages of the study is presented in the Figure 8.
The IR spectrum of the initial sample contains the same bands of functional groups, which were described above in experiment 1. However, there are some differences in their intensity due to the characteristics of the blood donor from which the sample was obtained. After a three-week storage of RBCs (stage IV) in the spectrum there were no noticeable changes that would indicate disturbance of the molecular structure of the erythrocyte membrane.
After four weeks (stage V), noticeable changes appear in the spectrum (some bands are smoothed, their intensity decreases, small peaks disappear).These changes indicate that the molecular structure of proteins and lipids of erythrocyte membranes begins to break down. After five weeks (stage VI) no significant changes in the spectrum were found. After six weeks of RBCs storage (stage VII)barely noticeable excesses associated with intramolecular oscillations are observed in the spectrum against the background of a wide blurred band in the vibration range O-H (1650-1500 cm-1) H2O that indicates the complete destruction of the molecular structure of erythrocyte membrane.
A sample of test of the RBCs suspension in preservative CPDA-1 with saline solution that previously was processed by ICNB on main stages of the study is presented in the Figure 9.
The dynamics of changes in the molecular structure of this sample is shown in Figure 8 demonstrates that it remains fully stable for four weeks storage of RBCs. The first signs of a slight decrease in the intensity of the lipid and protein of bands appear after four weeks storage of RBCs. Nevertheless these changes are much less pronounced than in the control sample of this series.
After six weeks, the spectrum changes mainly due to the shift of bands in the high-frequency region and smoothing of small peaks. This indicates a significant weakening of intra-and intermolecular bonds in the structure of RBCs. However, complete destruction of the membrane structure of RBCs is not observed.
After seven weeks of storage, only one weak band of erythrocytes remains in the spectrum, corresponding to the valence vibrations of the most stable bond n(N-H)+n(C-N) of Amide II, which previously (in sample of control) experienced a significant shift in the high-frequency region due to the weakening of this bond. The bands of deformation vibrations of protein and lipid molecules disappear, i.e. the molecular structure of erythrocytes is disturbed.
Summary of experiment 2
Analysis of changes occurring in the IR spectra of samples of control and test in the CPDA-1 medium was showed that during 49 days storage of:
6. Conclusion
The method of infrared spectroscopy made it possible to track the dynamics of changes in all important types of bonds in molecules of erythrocyte membranes at the stages of their storage at positive temperature. The results clearly showed that the presented method of application of nanotechnology significantly increases the storage time of RBCs in different versions of preservatives due to mechanisms to reduce violations of the molecular structure of proteins and lipids in the erythrocyte membranes. In the future, with used nanotechnologies is planned to continue to study the features of metabolic processes of preserved RBCs at storage stages at positive temperature.
Nevertheless, today it is obvious that the presented method of application of nanotechnology is not only safe for use in practice in the Blood Service, Transfusiology and Hematology, but also is the most promising innovation project.
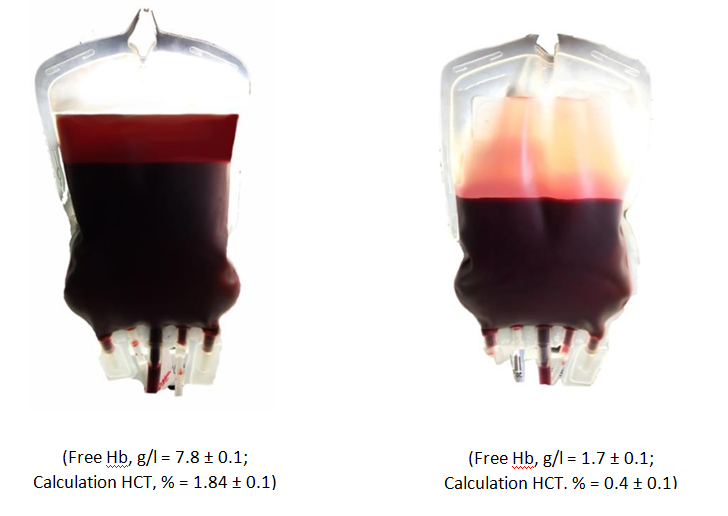
Figure 1: The hemolysis inhibition effect with using method of additive modernization of preservative solutions adapted to the manufacture process on the 35th day of the study.
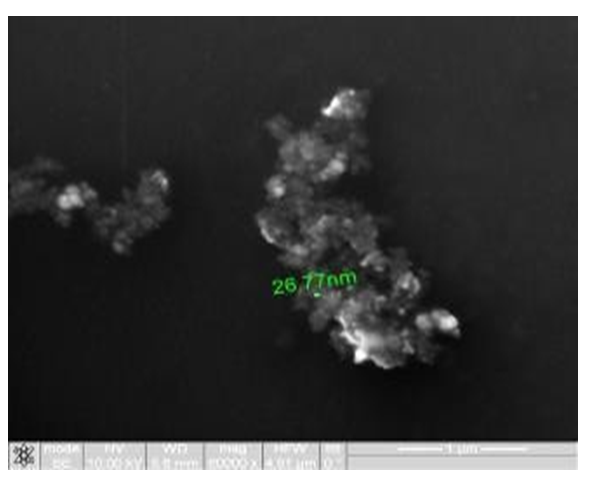
Figure 2: Study of magnetite nanoparticles with use microscope ion-electronic raster-type Quanta 200 3D
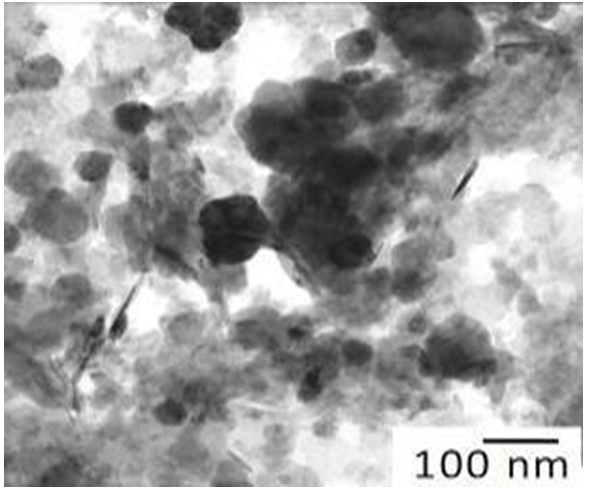
Figure 3: Study of magnetite nanoparticles with use microscope electronic translucent JEM-2100
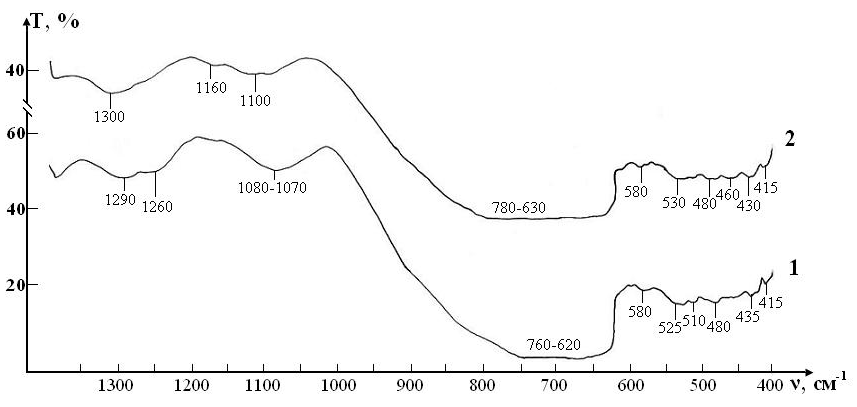
Figure 4: IR absorption spectra of initial erythrocyte suspensions in the range 400-1300 cm-1: curve 1- control; curve 2 - test
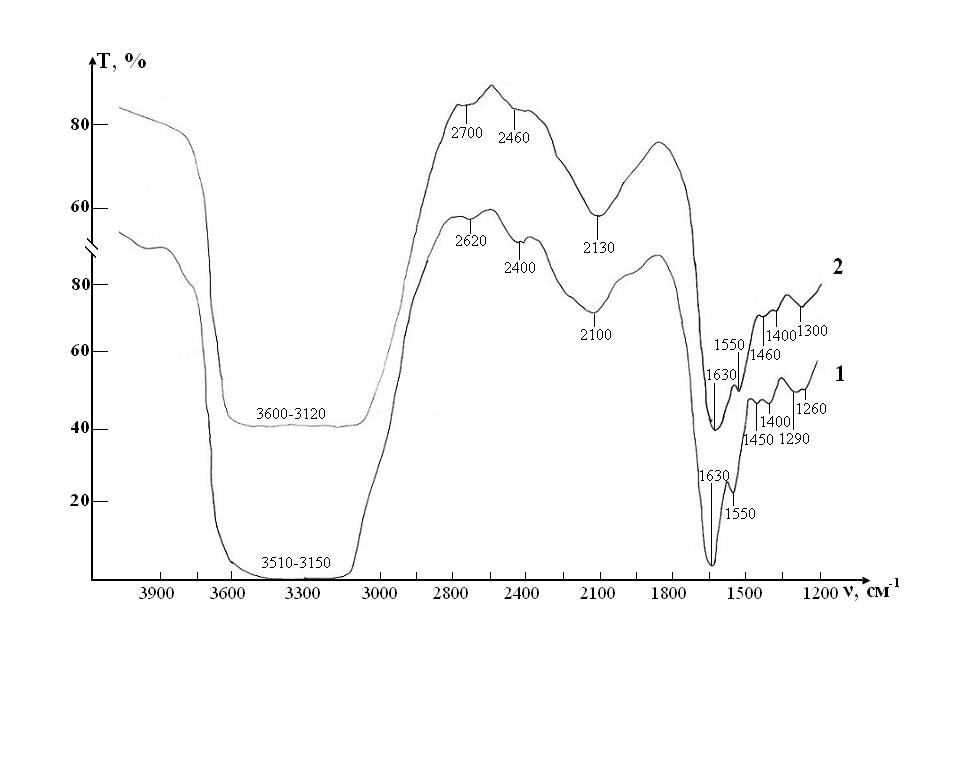
Figure 5: IR absorption spectra of initial erythrocyte suspensions in the range 1200-4000 ?m-1: curve 1- control; curve 2 - test
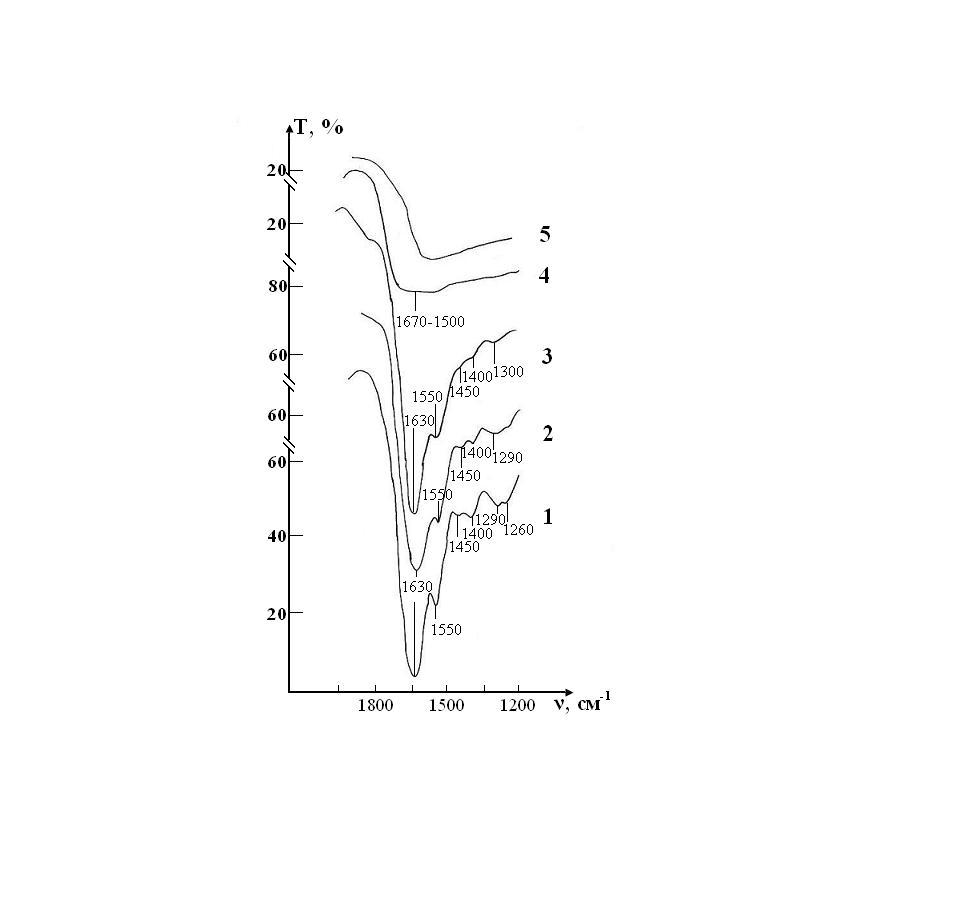
Figure 6: IR absorption spectra of the sample of control consisting of RBCs suspension in native saline solution in CPD medium: curve 1- stage I (day 1); curve 2- stage II (day 7); curve 3- stage III (day 14); curve 4- stage IV(day 21); curve 5- stage V(day 28).
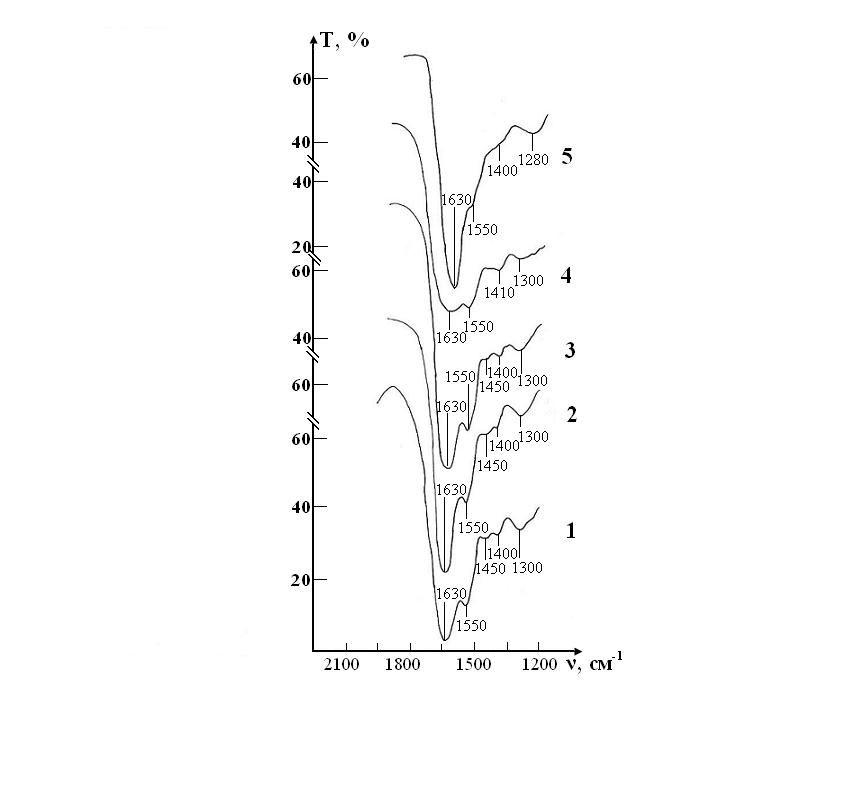
Figure 7: IR absorption spectra of a sample consisting of a suspension of erythrocytes in a saline solution treated with magnetite nanoparticles in CPD medium: curve 1- stage I (day 1); curve 2- stage II (day 7); curve 3- stage III (day 14); curve 4- stage IV (day 21); curve 5- stage V (day 28).
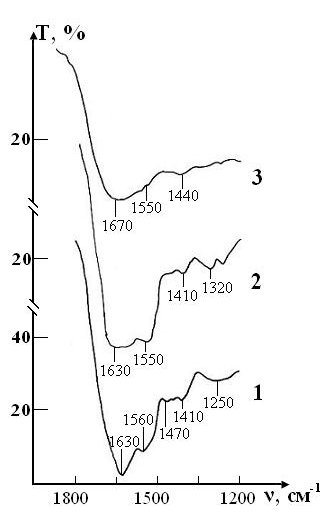
Figure 8: IR absorption spectra of the sample of control consisting of RBCs suspension in native saline solution in CPDA-1 mediumon main stages of the study: curve 1- stage I (day 1); curve 2 - stage V (day 28); curve 3 - stage VII(day 42).
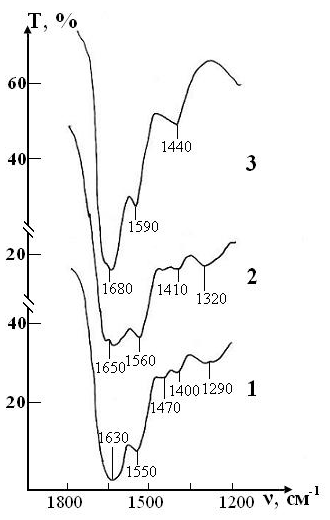
Figure 9: IR absorption spectra of the sample of test consisting of RBCs suspension in preservative CPDA-1 with saline solution that previously was processed by ICNB on main stages of the study: curve 1- stage I (day 1); curve 2 - stage V (day 28); curve 3 - stage VII (day 42).
|
Phase name |
a (?) |
b (?) |
c (?) |
alpha (degree) |
beta (degree) |
gamma (degree) |
|---|---|---|---|---|---|---|
|
magnetite low |
8.387836 |
8.387836 |
8.387836 |
90.00 |
90.00 |
90.00 |
|
magnetite low, syn |
5.930687 |
5.930687 |
14.705912 |
90.00 |
90.00 |
120.00 |
|
Johannsenite |
9.891680 |
9.059276 |
5.282908 |
90.00 |
105.54 |
90.00 |
Table 1: The calculated lattice parameters of the phases
|
Compound |
Weight% |
StdErr |
El |
Weight%/ O2 |
StdErr |
El |
Weight% |
StdErr |
|---|---|---|---|---|---|---|---|---|
|
Fe3O4 CaOP2O5 MnO SiO2 SO3 Cl |
97.37 2.26 0.280 0.255 0.098 0.032 0.0280 |
0.09 0.07 0.027 0.013 0.027 0.013 0.0090 |
Fe Ca PxMn Si Sx Cl |
68.40 1.71 0.122 0.198 0.046 0.0126 0.0280 |
0.07 0.05 0.012 0.010 0.013 0.0051 0.0090 |
Fe Ca Px Mn Si Sx Cl |
97.62 2.3 0.157 0.278 0.059 0.0164 0.0380 |
0.09 0.07 0.015 0.014 0.016 0.0066 0.012 |
Table 2: Determination of percent composition of the ICNB by ?-ray spectrometer ARL OPTIM'X (semi- quantitative analysis)
|
Phase |
Formula |
Space group |
? Card Database ICDD |
|
magnetite low |
Fe2.886 O4 |
227 : Fd-3m, choice-2 |
10861339 (ICDD) |
|
magnetite low, syn |
Fe3O4 |
166 : R-3m, hexagonal |
10716766 (ICDD) |
|
Johannsenite |
Ca Mn +2 Si2O6 |
15 : C12/c1, unique-b,cell-1 |
380413 (ICDD) |
Table 3: X-ray analysis of ICNB in X-ray diffractometer RigakuUltima IV (CuKα, Kβ filter - Ni), one-coordinate DTeX semiconductor detec
|
Phases (method of corundum numbers) |
Content, % |
|
magnetite low |
71 |
|
magnetite low, syn (hexagonal) |
29 |
Table 4: The phases of magnetite of nanoparticles (RIR - method; error 8 ± 3%)
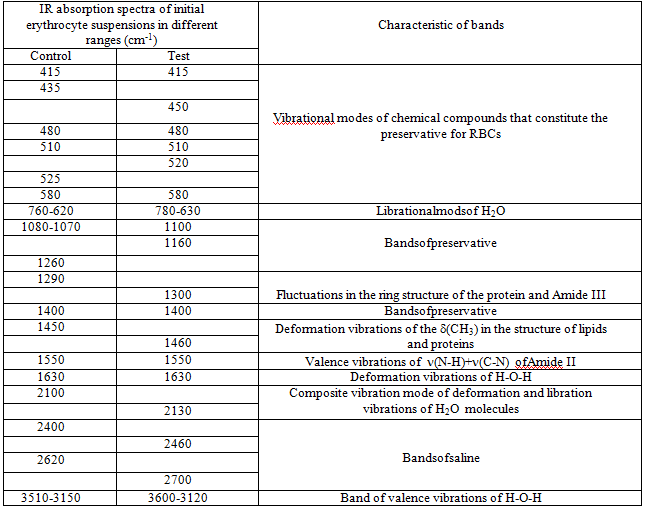
Table 5: Identification of absorption bands in the IR spectra of the initial RBCs suspension
J. Cell Mol. Biol. 2017. Henry Publishing Group 2: 1-4.
Citation: Belousov A, Malygon E, Yavorskiy V, Belousova E (2019) Stabilization of Molecular Structure Membranes of Preserved Rbcs by Means Nanotechnology. Ann Med & Surg Case Rep: AMSCR: 100001.