
Milkessa Asfaw *1, Endrias Geta1 and Fikadu Mitiku2
1College of Agriculture and Natural Resources, Mizan -Tepi University, Ethiopia
2College of Agriculture and Veterinary Medicine, Jimma University, Ethiopia
*Corresponding author: Milkessa Asfaw, College of Agriculture and Natural Resources, Mizan -Tepi University, Ethiopia, Tel: +251910586773.
Citation: Asfaw M, Geta E, Mitiku F (2019) Economic Efficiency of Smallholder Farmers in Wheat Production: The Case of Abuna Gindeberet District, Oromia National Regional State, Ethiopia. Open Acc J Agri Res: OAJAR-100013.
Received Date: 15 December, 2018; Accepted Date: 21 January, 2019; Published Date: 25 January, 2019
1. Abstract
Productivity enhancement through enhancing efficiency in cereal production in general and in wheat production in particular could be an important speed towards achieving food security. This study was aimed at estimating the levels of technical, allocative and economic efficiencies of smallholder wheat producers; and to identify factors affecting efficiency of small holder farmers in wheat production in Abuna Gindeberet district, Oromia National Regional State, Ethiopia. Two stages sampling technique was used to select 152 sample farmers to collect primary data pertaining of 2016/17 production year. Both primary and secondary data sources were used for this study. Stochastic production frontier approach and two limit Tobit model was employed for data analysis. The stochastic production frontier model indicated that input variables such as mineral fertilizers, land and seed were the significant inputs to increase the quantity of wheat output. The estimated mean values of technical, allocative and economic efficiencies were 78, 80 and 63% respectively, which indicate the presence of inefficiency in wheat production in the study area. A two-limit Tobit model result indicated that technical efficiency positively and significantly affected by sex of the household head, education, extension contact, off/non-farm activity and soil fertility but negatively affected by land fragmentation. Similarly, age, education, extension contacts and off/non-farm activity positively and significantly affected allocative efficiency. In addition, economic efficiency positively and significantly affected by sex, age, education, extension contact, off/non-farm activity and soil fertility. The policy measures derived from the results include: expansion of education, strengthening the existing extension services, establish and/or strengthening the existing off/non-farm activities and strengthening soil conservation practices in the study area.
2. Keywords: Cobb-Douglas; Economic efficiency; Ethiopia; Smallholder; Stochastic Frontier
3. Introduction
Agriculture is a center driver of Ethiopian economy. Economic growth of the country is highly linked to the success of the agricultural sector. It accounts for about 36.3% of the Gross Domestic Product (GDP), provides employment opportunities to more than 73% of total population that is directly or indirectly engaged in agriculture, generates about 70% of the foreign exchange earnings of the country and 70% raw materials for the industries in the country [1]. Even though it is contributing a lot to the Ethiopian economy, the agricultural sector is explained by low productivity, caused by a combination of natural calamities, demographic factors, socio-economic factors; lack of knowledge on the efficient utilization of available; and limited resources (especially land and capital); poor and backward technologies and limited use of modern agricultural technologies [2]. Moreover, the sector is dominated by smallholder farmers that are characterized by subsistence production with low input use and low productivity, and dependency on traditional farming and rainfall.
In sub-Saharan Africa, Ethiopia is the second largest producer of wheat, following South Africa. Wheat is one of the major staple and strategic food security crops in Ethiopia. It is the second most consumed cereal crop in Ethiopia next to maize. It is a staple food in the diets of several Ethiopian, providing about 15% of the caloric intake [3], placing it second after maize and slightly ahead of teff, sorghum, and enset, which contribute 10-12% each [4]. It has multipurpose uses in making various human foods, such as bread, biscuits, cakes, sandwich, etc. Besides, wheat straw is commonly used as a roof thatching material and as a feed for animals [5].
In Oromia region, the total area covered by wheat was 898,455.57 hectare produced by 2.21 million smallholders; the total production was 2.66 million tons; and average productivity was 2.96 ton/ha [6]. According to Abuna Gindeberet district agriculture and natural resource development office reports of (2016/17), about 22,020 hectares of land was covered by cereal crops. Of these, 6,240 hectares of land was covered with wheat with total production of 174,721 quintals. Despite its increase in area and production, its productivity is low (2.8 ton/ha) which is below the average of productivity in the region (2.96 ton/ha). There was also variation of productivity among wheat producers in the district due to difference in inputs application rates and management practices like timely sowing.
Efficient production is the basis for achieving overall food security and poverty reduction objectives particularly in major food crops producing potential areas of the country [7]. However, farmers are discouraged to produce more because of inefficient agricultural systems and differences in efficiency of production [8]. When there is inefficiency; attempts to introduce new technology may not result in the expected impact since the existing knowledge is not efficiently utilized. The presence of inefficiency not only limits the gains from the existing resources, it also hinders the benefits that could arise from the use of improved inputs. Hence, improvement in the level of efficiency will increase productivity by enabling farmers to produce the maximum possible output from a given level of inputs with the existing level of technology [9-11].
Many researchers, in different sectors, have done many performance evaluation studies in Ethiopia. However, the majority of farm efficiency studies are limited to technical efficiency [10,12-16]. But, focusing only on technical efficiency (TE) understates the benefits that could be derived by producers from improvements in overall performance. Unlike technical efficiency, studies conducted on economic efficiency (EE) of wheat are limited [17,18]. Moreover, there is no study done on economic efficiency of smallholder wheat producers in the study area. Therefore, this study was attempted to fill the existing knowledge gap.
4. Research Methodology
4.1. Description of the study area
Abuna Gindeberet district is located in West Shewa Zone, Oromia National Regional state in the Western part of Ethiopia. It is located at 184 km west of the capital city of the country, Finfinne. It is bordered by Meta Robi district in East, Gindeberet district in West, Jeldu district in South and Amhara National Regional State in North. The district has 42 rural kebeles administrations and 2 urban kebeles. The total area of the district is 138,483.25 ha, of which annual crops cover 87,784.25 ha and the remaining land is allocated for grazing, forest and other purposes. The annual rainfall of the study area ranges from 700-2400 mm with an annual temperature of 10-300C. The study area has total population of 126,996 of which 47.2% are male and 52.8% are female [19]. Livelihood of the population of the study area generally depends on rain fed agriculture and characterized by mixed crop-livestock farming systems where both crop and livestock production play a central role in the lives of the farming community.
4.2. Sampling technique and sample size determination
Two stages random sampling procedures were employed to draw a representative sample. In the first stage, three kebeles out of the fifteen wheat producing kebeles in the district were randomly selected. In the second stage, 152 sample farmers were selected using simple random sampling technique based on probability proportional to the size of wheat producers in each of the three selected kebeles. To obtain a representative sample size, the study employed the sample size determination formula given by [20] as follow:

Where:
n - Denotes sample size;
N - Denotes total number of wheat producer household heads in the district and
e - Denotes margin error
4.3. Types of data and methods of data collection
This study used both qualitative and quantitative data. Both primary and secondary data sources were used. The primary data were collected using structured questionnaire that was administered by the trained enumerators. The questionnaire was pre-tested and necessary corrections were made before actual use.Moreover, local measurement scales customarily used by farmers was converted into their respective standard units. This helps to minimize measurement errors that could arise from variability of local units. Secondary data were also collected from relevant sources such as bureau of agriculture of the district and other relevant sources.
4.4. Method of data analysis
Both descriptive and econometric models were used to analyze the data. Descriptive statistics like mean, percentage, frequency and standard deviation were used. Stochastic production frontier was employed to estimate efficiency level of sampled farmers. In addition, two limit Tobit model was used to analyze the determinants of efficiency.
4.5. Method of data analysis
Both descriptive and econometric models were used to analyze the data. Descriptive statistics like mean, percentage, frequency and standard deviation were used. Stochastic production frontier was employed to estimate efficiency level of sampled farmers. In addition, two limit Tobit model was used to analyze the determinants of efficiency.
4.5. Descriptive analysis
Descriptive statistics techniques were used to describe demographic, farm, socio economic and institutional characteristics of smallholder wheat producers.
4.6. Econometric model specification
Most empirical studies on efficiency in Ethiopia were analyzed using stochastic production frontier methodology [11,17,21]. The main reason is that stochastic approach allows for statistical noise such as measurement error and climate change which are beyond the control of the decision making unit.
Following [22] the model is specified as follows:

Where:
i - Denotes the number of sample households
lnYi - Denotes the natural log of (scalar) output of the ith households
Xi - Represent a vector of input quantities used by the ith households:
βi - Denotes a vector of unknown parameters to be estimated
vi - is a symmetric component and permits a random variation in output due to factors beyond the control of farmers. It is assumed to be independently and identically distributed N~(0, σ2v)and
ui - intended to capture inefficiency effects in the production of wheat measured as the ratio of observed output to maximum feasible output of the ith farm. It is assumed to be independently and identically distributed as half-normal, u~N (u, σ2u).
After specification of SFP the next step is estimation of TE for individual firms. Accordingly, the study computes TE for the ith firms as:
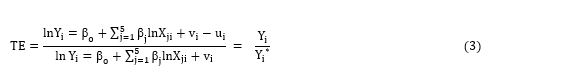
The value of TE lies between zero and one implying fully technically inefficient and fully technically efficient respectively. Following [23] the stochastic cost frontier function was specified which forms the basis of computing EE and AE of wheat production. The dual cost frontier is specified as:

Where:
ln Ci - Denotes the logarithm of the cost of production of the ith firm;
Pji - Denotes a vector of inputs price and output of ith firm;
βo, βj - Denotes a vector of unknown parameter to be estimated;
vi - Denotes random variables assumed to be independent and identically distributed random errors with zero mean and variance(σv2) and
ui - Denotes non-negative random variables which are assumed to account for cost in efficiency
4.7.Determinants of efficiency
After we estimate cost efficiency, allocative efficiency is computed as the inverse of cost efficiency. Economic efficiency is the product of technical and allocative efficiencies.
In this study, to analyze the effect of demographic, socioeconomic, farm attributes and institutional variables on efficiencies, two-limit Tobit model was employed. This model is best suited for such analysis because of the nature of the dependent variable (efficiency scores), which takes values between 0 and 1 and yield the consistent estimates for unknown parameter vector [24]. Estimation with OLS regression of the efficiency score would lead to a biased parameter estimate since OLS regression assumes normal and homoscedastic distribution of the disturbance and the dependent variable [25].
Following [24] the model can be specified as:

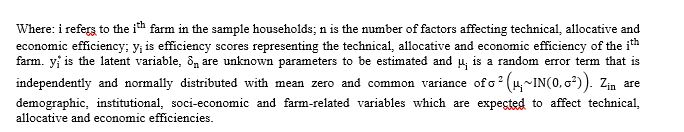
Denoting yi as the observed variables,
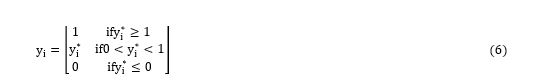
The distribution of dependent variable in equation (3.13) is not normal distribution because its value varies between 0 and 1. The ordinary least square (OLS) estimation will give biased estimates [24]. Therefore, the alternative approach is using the maximum likelihood estimation which can yield the consistent estimates for unknown parameters. Following [24], the likelihood function of this model is given by:
Where L1j=0 (lower limit) and L2j=1 (upper limit) where φ(.) and  are normal and standard density functions. In practice, since the log function is monotonically increasing function, it is simpler to work with log of likelihood function rather than likelihood function and the maximum values of these two functions are the same [25].
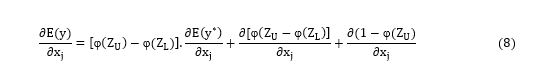
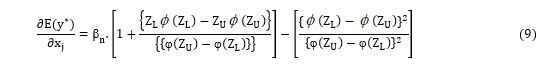
The regression coefficients of the two-limit Tobit regression model cannot be interpreted like traditional regression coefficients that give the magnitude of the marginal effects of change in the explanatory variables on the expected value of the dependent variable. In a Tobit model, each marginal effect includes both the influence of explanatory variables on the probability of dependent variable to fall in the uncensored part of the distribution and on the expected value of the dependent variable conditional on it being larger than the lower bound. Thus, the total marginal effect takes into account that a change in explanatory variable will have a simultaneous effect on probability of being technically, allocatively and economically efficient and value of technical, allocative and economic efficiency score. A useful decomposition of marginal effects that was extended by [26] was proposed by [27]. From the likelihood function of this model stated in equation (7), [26] showed the equations of three marginal effects as follows:
1) The unconditional expected value of the dependent variable:
2) The expected value of the dependent variable conditional upon being between the limits
3) The probability of being between the limits

where φ.= the cumulative normal distribution,  = the normal density function, ZL=-β'X/σ and ZU=(1-βX/σ are standardized variables that came from the likelihood function given the limits of y*, and σ= standard deviation of the model. The marginal effects represented by the equations above were calculated by the STATA command mfx which was complemented by specific options that allowed the estimation of marginal effects of change in explanatory variables.
In SPF hypothesis tests can be made that are not possible in non-parametric models. Following [25], a number of tests of hypotheses were made in this study using the usual likelihood ratio (LR) test given by equation (11):

Where:
L(H0) - Denotes the likelihood function value under the null hypothesis(H0)
L(H1) - Denotes the likelihood function value under alternative hypothesis(H1)
In most cases, this function has an asymptotic chi-square distribution. Thus, if the value of LR (λ) exceeds the critical/tabulated χ 2 statistic, then the null hypothesis would be rejected in favor of the alternative and vice versa. All the parameters of production frontier, dual cost frontier and two limit Tobit model were estimated using STATA version 13.
5. Results and Discussion
5.1. Summary statistics of variables used in production and cost functions
On average, the sampled households produced 15.08 qt of wheat, which is the dependent variable in the production function. The land allocated for wheat production, by sampled households during the survey period was ranged from 0.125 to 2.5 ha with an average of 0.712 ha. Similarly, on average the sampled farmers incurred 13,607.46 birr to produce 15.08 quintal of wheat. Among the five factors of production, the cost of land and labor accounted for the highest share 30.79 and 27.79%, respectively (Table 1).
5.2. Summary statistics of variables used in efficiency model
The summary statistics of demographic, socioeconomic, farm and institutional variables which were expected to affect technical, allocative and economic efficiency levels of small holder farmers in the study area are presented in (Table 2) below.
6. Econometric Results
6.1. Hypotheses test
In this study, three hypotheses were tested. Accordingly, the functional form that can best fit to the data at hand was selected by testing the null hypothesis which states that the coefficients of all interaction terms and square specifications in the translog functional forms are equal to zero (H0: βij=0) against alternative hypothesis which states that the coefficients of all interaction terms and square specifications in the translog functional forms are different from zero (H1: βij≠0). This test was made based on the value of likelihood ratio (LR) statistics which could be computed from the log likelihood values of both the Cobb-Douglas and Translog functional forms using equation (12) below.

The  value computed by the above formula was compared with the upper 5% critical value of the
  at the degree of freedom equals to the difference between the number of explanatory variables used in both functional forms (in this case degree of freedom =15). Accordingly, the log likelihood functional values of both Cobb-Douglas and Translog production functions were -34.84 and -26.32 respectively. Therefore, the
  value computed was 17.04 and this value is lower than the upper 5% critical value of at 15 degree of freedom (24.9) (Table 3). This shows that the coefficients of the interaction terms and the square specifications of the production variables under the Translog specifications are not different from zero. As a result, the null hypothesis was accepted and the Cobb-Douglas functional form best fits the data.
The second test is to test the null hypothesis that the inefficiency component of the total error term is equal to zero (γ=0) and alternative hypothesis that inefficiency component different from zero. Thus, the likelihood ratio is calculated and compared with the χ2 value at a degree of freedom equal to the number of restrictions (the inefficiency component) estimated by the full frontier, which is 1 in this case for all models.
As explained in Table 3, one-sided generalized  test of γ=0 provide a statistic of 12.2 for wheat production; which is significantly higher than the critical value of χ2 for the upper 5% at one degree of freedom (3.84). Rejecting the null hypothesis implies that the average response function estimated by OLS, which assumes all farmers are technically efficient is an insufficient representation of the data, given the stochastic frontier and the inefficiency effects model. Consequently, the null hypothesis that wheat producers in the study area are fully efficient is rejected.
The third hypothesis tested was that all coefficients of the inefficiency effect model are simultaneously equal to zero (i.e.H0: δ0= δ1=δ2=…δ12=0) against the alternative hypothesis, which states that all parameter coefficients of the inefficiency effect model are not simultaneously equal to zero. The null hypothesis is to mean that the explanatory variables in the inefficiency effect model do not contribute significantly to the explanation of efficiency variation for wheat producing farmers. It was also tested in the same way by calculating the  value using the value of the log likelihood function under the stochastic frontier model (without explanatory variables of inefficiency effects,H0) and the full frontier model (with variables that are supposed to determine efficiency level of each farmer, H1). Using the formula in Equation (7), the value obtained was 77.56, which is higher than the critical χ2 value (21.03) at the degree of freedom equal to the number of restrictions to be zero (in this case the number of coefficients of the inefficiency effect model was 12). As a result, the null hypothesis is rejected in favor of the alternative hypothesis that explanatory variables associated with inefficiency effect model are simultaneously not equal to zero. Hence, these variables simultaneously explain the difference in efficiency among sampled farmers.
6.2. The MLE of the parametric stochastic production frontier
Given the specification of Translog, the Cobb-Douglas stochastic production was tested and found to best fit to the data and was used to estimate efficiency of farmers. The dependent variable of the estimated production function was wheat output (Qt) and the input variables used in the analysis were area under wheat (ha), oxen (pair of oxen-days), labor (man-days in man-equivalent), quantity of seed (kg) and quantity of fertilizer (Kg).
Land allotted for wheat production and mineral fertilizers are found to be statistically significant at 1% significance level implying that increasing the level of these inputs would increase wheat yield in the study area. Mineral fertilizers also appeared to be an important factor, with coefficient of 0.353. This implies that a 1% increase in mineral fertilizers enhance wheat output by about 0.35% at ceterius paribus. This result is in line with the empirical results of [7,11-13,16,21,28-30].
The coefficients related with the inputs measure the elasticity of output with respect to inputs. The results showed that the input variables specified in the model had elastic effect on the output of wheat production. The scale coefficient calculated was 1.214, indicating increasing returns to scale. This implies that there is potential for wheat producers to expand their production because they are in the stage I production area. This implies that, a 1% increase in all inputs proportionally would increase the total production of wheat by 1.214%. Therefore, an increase in all inputs by 1%would increase wheat output by more than 1%. This result is consistent with the empirical results of [13] and [15] who estimated the returns to scale of 1.33 and 1.38% in the study of technical efficiency of wheat production in South Wollo and Hadiya zone, Ethiopia respectively (Table 4).
The diagnostic statistics of inefficiency component reveals that sigma squared (σ2) was statistically significant which indicates goodness of fit, and the correctness of the distributional form assumed for the composite error term. The estimated value of Gamma  is 0.6778 which indicates that 67.78% of total variation in farm output from the frontier is due to technical inefficiency. The dual frontier cost function derived analytically from the stochastic production frontier shown in (Table 4) is given by:

Where Ci is the minimum cost of production of the  farmer, Y* refers to the index of output adjusted for any statistical noise and scale effects and wstands for input costs.
6.3. Efficiency scores and their distribution
The mean TE of sample farmers was about 0.78 with a minimum level of 0.29 and the maximum level of 0.95. This means that if the average farmer in the sample was to achieve the technical efficient level of its most efficient counterpart, then the average farmer could realize 17.12% derived from (1-0.784/0.946)*100 increase in output by improving technical efficiency with existing inputs and technology. The average AE of the sample farmers was about 0.80 with a minimum of 0.34 and a maximum of 0.98. This shows that farmers are not allocatively efficient in producing wheat and hence, a farmer with average level of allocative efficiency would enjoy a cost saving of about 17.19%. Similarly, the mean EE of the sample farmers was 0.63 implying that there was a significant level of inefficiency in the production process. The mean levels of efficiencies were comparable to those from other similar studies in Ethiopia. Accordingly, [30] found mean TE, AE and EE of 0.79, 0.83 and 0.66 respectively for teff producers in Northern Shewa, Ethiopia. In addition, [17] found mean TE, AE and EE of 0.79, 0.47 and 0.37 respectively for wheat seed producer farmers in West Gojjam, Ethiopia (Table 5).
The distribution of the technical efficiency scores showed that about 47.36% of the sample households had technical efficiency score of 80 to 90%. The allocative efficiency distribution scores indicated that about 27.63% of wheat producers operated above 90% efficiency level. The distribution of economic efficiency scores implies that 36.18% of the household heads have an economic efficiency score of 50-60%. This also indicates the existence of substantial economic inefficiency than technical and allocative inefficiency in the production of wheat during the study period in the study area (Figure 1).
6.4. Determinants of efficiency
To find out factors that affect efficiency levels among the sampled farmers, the technical, allocative and economic efficiency levels derived from stochastic frontier were regressed on factors that were hypothesized to affect efficiency levels by using a two limit Tobit model. In this study, the dependent variable is efficiency scores not inefficiency. Thus, the marginal effect should be interpreted as their effect on efficiency and not inefficiency and if one wants to use inefficiency, the sign of the marginal effect, has to be changed.
The finding of the study shows that age affected allocative and economic efficiency of the smallholder farmers in wheat production positively and significantly at 10 and 1% significance level, respectively. This implies that older farmers were more efficient than younger ones. This was probably because older farmers may have better experience in farming. Moreover, farmers at older age may accumulate good control of resources like oxen, farm tools and labor that could boost their efficiency, since in crop production, better availability of farm resources enhances timely application of inputs that increase efficiency of the farmer [31]. Furthermore, the computed marginal effect of age of the household head showed that, a one year increase in the age of the household head would increase the probability of the farmer being allocatively efficient by about 0.13% and the mean value of allocative and economic efficiency by 0.12 and 0.14% with an overall increase in the probability and the level of allocative and economic efficiencies by 0.14 and 0.14%, respectively. Similar positive and significant effect of age of the household head on efficiency was found by [31-33] in their respective studies.
The coefficient for sex of the household head was significant and positively affected technical and economic efficiencies of farmers at 1% significance level, as it was expected. It indicated male headed households operating more efficiently than their female counterparts. This result is in line with the findings of [16] and [34]. As expected, educational level of the household head had a positive and significant effect on TE, and AE at 5% and EE of wheat production at 1% level of significance. This is because education can increase their information acquisition and adjustment abilities, thereby- increasing their decision making capacity. In line with this study, research done by [11,17,21] explains that the more educated the farmer, the more technically, allocatively and economically efficient s/he becomes.
The model result also indicated that soil fertility was positively and significantly affected technical and economic efficiencies at 1 and 5% level of significance, respectively. This implies that farmers who have allocated fertile land for wheat production were more technically and economically efficient than their counterparts. This result is consistent with the empirical findings of [12,15,18,28]. Frequency of extension contact had significant and positive effect on technical efficiency at 5%, allocative and economic efficiencies at 1% significance level, respectively. This indicates households who receive more extension contacts by extension workers appear to be more efficient than their counterparts. This result is similar with the findings of [11,30,31].
It was hypothesized that a farmer participated in off/non-farm activity were more efficient than counterparts. As it was hypothesized the coefficient of participation in off/non-farm activity was positive and significant for technical and economic efficiency at 1% whereas allocative efficiency at 5% significance level. Participation in off/ non-farm activity affect efficiency positively for the reason that the income obtained from such activities could be used for the purchase of agricultural inputs, and may be because of the availability of off/non-farm income shifts the cash constraint outwards and enables farmers to make timely purchase of those inputs which they cannot provide from on farm income. This result is in line with the empirical findings of [17,31,35]. The coefficient of land fragmentation for technical efficiency is negative and statistically significant at 10% significance level as it was expected. The result confirms the expectation, because fragmented land leads to reduce efficiency by creating lack of family labor, wastage of time and other resources that would have been available at the same time. This result is in line with the empirical results of [15] and [29] (Table 6).
7. Conclusion and Recommendations
7.1. Conclusion
Result of the production function indicated that seed, land and mineral fertilizers were the significant inputs, with positive sign as expected. Among the three significant inputs, mineral fertilizers and land under wheat production had significant and positive influence on wheat production at less than 1% level of significance. This depicts that farmers who allocated more land for wheat production and those who applies more amount of mineral fertilizers receive higher wheat yields. The coefficients related with the inputs measure the elasticity of output with respect to inputs. The results showed that the input variables specified in the model had elastic effect on the output of wheat production. The coefficient calculated was 1.214, indicating increasing returns to scale This implies that, a 1% increase in all inputs proportionally would increase the total production of wheat by 1.214%. Therefore, an increase in all inputs by 1% would increase wheat output by more than 1% in the study area.
The estimated mean values of technical, allocative and economic efficiency levels were 78, 80 and 63%, respectively. This implied wheat producer in the study area are not operating at full technical, allocative and economic efficiency levels. In other words, the result indicated that there is opportunity for wheat producers to increase wheat output at existing levels of inputs and minimize cost without compromising yield with present technologies available in the hands of producers.
The factors that affect efficiency of the sampled households were identified to help different stakeholders to boost the current level of efficiency in wheat production by using two limit Tobit model. Accordingly, education, extension and participation in off/non-farm activity had positive and significant effect on technical, allocative and economic efficiencies. This shows that more educated farmers, the more farmers have contact with extension agent and farmers participating in off/non-farm activities were more technically, allocatively and economically efficient than their counterparts respectively. In addition, as it was expected sex and soil fertility had positive and significant effect on technical and economic efficiencies, implying that male headed households, household heads who allocate fertile land for wheat production were more technically and economically efficient than their counterparts, respectively. Similarly, age had a positive and significant effect on allocative and economic efficiencies, which implies that older household heads were more efficient than their counterparts. Moreover, land fragmentation had negative and significant impact on technical efficiency. This implies that household heads with small number of plots were more efficient than their counterparts.
7.2. Recommendations
The results of this study give information to policy makers on how to improve the TE, AE and EE efficiency and optimal use of resources in the study area. The following policy recommendations have been drawn based on the results of the study. First, using best practices of the efficient farmers as a point of reference would help setting targets in improving efficiency levels and finding the weakness of the present farm practices. The relatively efficient farms can also improve their efficiency more through learning the best resource allocation decision from others. This can be achieved by arranging field days, cross-visits, creating forum for experience sharing with elder households and on job trainings.
Age, used as a proxy for experience, showed a positive and significant effect on efficiency. This may be due to experience learnt over the years of farming activity. Therefore mechanisms should be devised to encourage farmers with little experience to work with the experienced ones or train them. This could be done via the Farmer Training Center (FTC) in which the experienced farmers are trained and let to diffuse their accumulated practices to the youngsters with less experience. The results of the study also shows, as female household heads were less efficient than male household heads. This is may be due to female headed households are too busy with domestic activities and had less time to manage their farm plots. Thus, especial emphasis should have to given for female headed households by providing improved technologies that can help them in decreasing their home burden and this would in turn help them to improve their efficiency level in wheat production.
In the study area, education of household heads had positive and significant effect on technical, allocative and economic efficiencies. Hence, the key policy implication is that appropriate policy should be designed to provide adequate and effective basic educational opportunities for farmers in the study area. In this regards, the regional government should have a main responsibility to keep on providing basic education in these areas and facilitates the necessary materials so that farmers can understand agricultural instructions easily and have better access to information and use the available inputs more efficiently. The result of the study indicated that extension contact has positive and significant effect on technical, allocative and economic efficiencies. Therefore, suitable and sufficient extension services should be provided for the farmers in the study area. This could done by manipulative appropriate ability building program to train additional development agents and to provide refreshment training for development agents.
The study also found that, participation in off/non-farm activity had a positive and significant effect on technical, allocative and economic efficiencies. This implies that financing timely and enough use of inputs through additional income generated by off/non-farm are critical. Therefore, strategies that enhance the ease use of off/non-farm employment opportunities would help to increase the timely and appropriate use of inputs for better efficiency in wheat production in the study area. Moreover, technical and economic efficiency were positively and significantly affected by soil fertility. Therefore, improvement of the soil status by applying organic manures and practicing different soil conservation techniques should have to done by farmers. In addition, extension workers in the study area can play a great role in improving the soil status by working closely with the farmers.
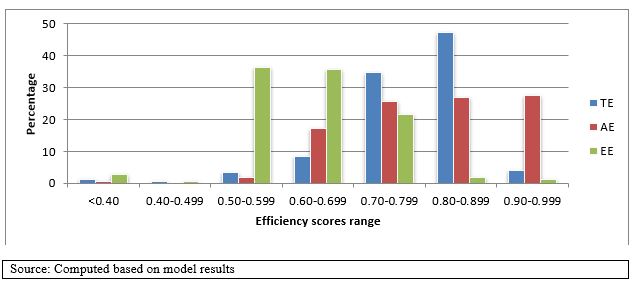
Figure 1: Frequency distribution of technical, allocative and economic efficiencies scores
|
Variables |
Unit |
Mean |
Std.Dev. |
Min |
Max |
|
Output |
Quintal |
15.08 |
10.8 |
2 |
57 |
|
Seed |
Kilogram |
122.75 |
85.57 |
20.00 |
445 |
|
Land |
Hectare |
0.712 |
0.45 |
0.125 |
2.5 |
|
Labor |
Man-days |
62.21 |
37.4 |
10.00 |
215.6 |
|
Mineral fertilizers |
Kilogram |
118.09 |
82.9 |
20.00 |
525 |
|
Oxen |
Oxen-days |
29.43 |
15.62 |
5.00 |
81 |
|
Total cost of production |
Birr |
13,607.46 |
10,274.58 |
1,700 |
59,850 |
|
Cost of seed |
Birr |
9,73.48 |
900.65 |
131.25 |
6500 |
|
Cost of land |
Birr |
4,037.45 |
2,492.11 |
678.12 |
12000 |
|
Cost of labor |
Birr |
3,644.37 |
2,199.40 |
650 |
11858 |
|
Cost of mineral fertilizers |
Birr |
1,240.15 |
888.17 |
202.8 |
6037.5 |
|
Cost of oxen |
Birr |
3,217.05 |
1,767.18 |
475 |
11400 |
|
Source: own computation (2018) |
|||||
Table 1: Summary statistics of variables used to estimate the production and cost function
|
Variables |
Mean |
Std. Dev. |
Percentage of the mean with dummy = 0 |
Percentage of the mean with dummy = 1 |
|
Age of the household head (years) |
47.89 |
10.05 |
- |
- |
|
Family size (ME) |
6.12 |
1.80 |
- |
- |
|
Educational level (years) |
5.82 |
3.04 |
- |
- |
|
Frequency of extension contact |
5.69 |
2.69 |
- |
- |
|
Cultivated land (ha) |
0.84 |
0.70 |
- |
- |
|
Livestock (TLU) |
6.95 |
3.17 |
- |
|
|
Distance to the nearest market (min) |
32.97 |
13.32 |
- |
- |
|
Land fragmentation |
2.08 |
0.85 |
- |
- |
|
Sex of the household head |
- |
- |
22.37 |
77.63 |
|
Fertility status of the soil |
- |
- |
26.32 |
73.68 |
|
Credit utilization |
- |
- |
41.45 |
58.55 |
|
Participation in off/non- farm activities |
- |
- |
32.24 |
67.76 |
|
Source: own computation (2018) |
||||
Table 2: Summary of variables used in efficiency model
|
Null hypothesis |
Df |
|
Critical value |
Decision |
|
Ho:βij = 0 |
15 |
17.04 |
24.9 |
Accept H0 |
|
Ho:γ = 0 |
1 |
12.2 |
3.84 |
Reject H0 |
|
Ho:δ0 = δ1 = δ2 = … δ12 = 0 |
12 |
77.56 |
21.03 |
Reject H0 |
|
Source: Own computation (2018) |
||||
Table 3: Generalized Likelihood Ratio test of hypotheses for parameters of SPF
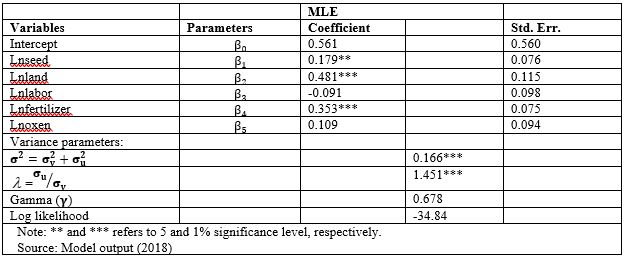
Table 4: Estimates of the Cobb Douglas frontier production function
|
Types of efficiency |
Mean |
Std.Dev. |
Min |
Max. |
|
TE |
0.784 |
0.090 |
0.289 |
0.946 |
|
AE |
0.809 |
0.114 |
0.343 |
0.977 |
|
EE |
0.635 |
0.109 |
0.099 |
0.911 |
|
Source :Model output (2018) |
||||
Table 5: Estimated technical, allocative and economic efficiency scores
|
Variable |
TE |
AE |
EE |
|||
|
|
Coefficient |
Std.Err |
Coefficient |
Std.Err |
Coefficient |
Std.Err |
|
Constant |
0.6402*** |
0.0461 |
0.5994*** |
0.0611 |
0.3656*** |
0.0423 |
|
AGEHH |
0.0007 |
0.0006 |
0.0015* |
0.0008 |
0.0014*** |
0.0005 |
|
SEXHH |
0.0821*** |
0.0148 |
-0.0127 |
0.0196 |
0.0516*** |
0.0136 |
|
EDUCLHH |
0.0048** |
0.0022 |
0.0068** |
0.0029 |
0.0088*** |
0.0020 |
|
FOEC |
0.0053** |
0.0027 |
0.0166*** |
0.0035 |
0.0171*** |
0.0024 |
|
PONFAC |
0.0472*** |
0.0136 |
0.0375** |
0.0181 |
0.0648*** |
0.0125 |
|
SOILFERT |
0.0375*** |
0.0137 |
0.0028 |
0.0182 |
0.0252** |
0.0126 |
|
LANDFR |
-0.0135* |
0.0070 |
-0.0008 |
0.0093 |
-0.0082 |
0.0064 |
|
Note: *,** and *** refers to level of significance at 10, 5 and 1% respectively Source: Model output (2018) |
||||||
Table6: Tobit regression results of determinants of technical, allocative and economic efficiency
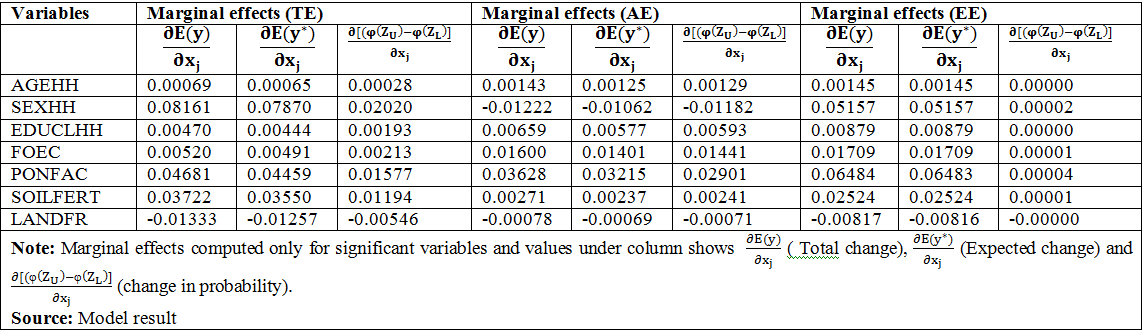
Table 7: The marginal effects of change in explanatory variables
Citation: Asfaw M, Geta E, Mitiku F (2019) Economic Efficiency of Smallholder Farmers in Wheat Production: The Case of Abuna Gindeberet District, Oromia National Regional State, Ethiopia. Open Acc J Agri Res: OAJAR-100013.