
Emerging Infectious Diseases and Diagnosis Journal
ISSN 2652-4449
Volume 02; Issue 02
Review Article
Bio statistical Analysis of Taxi Scheduling based on Stochastic Decision Model
Cao J1 and Zhao B2*
1School of Information and Mathematics, Yangtze University, Jingzhou, Hubei, China.
2School of Science, Hubei University of Technology, Wuhan
*Corresponding author: Bin Zhao, School of Science, Hubei University of Technology, Wuhan, Hubei, China.
Citation: Cao J and Zhao B (2020) Bio statistical Analysis of Taxi Scheduling based on Stochastic Decision Model. Emerg Infect Dis Diag J: EIDDJ-1002939019
Received date: 22 April, 2020; Accepted date: 25 April, 2020; Published date: 04 May, 2020
Abstract
From the perspective of taxi drivers and airport managers, this paper makes a detailed analysis and solution to the problem of airport taxi scheduling by using the stochastic decision model. Based on the stochastic decision model, the selection strategies of taxi drivers are given by considering the seasonal weather and flight information. Firstly, the revenue function is introduced to calculate the revenue of strategy A (line up to pick up passengers) and strategy B (take no passengers back to the city) in the same time respectively. For the queuing loss, we give the probability calculation model of the average waiting time through the relationship between the number of existing vehicles in the storage pool and the initial number of queuing people, the arrival intensity of queuing, the boarding time and the number of boarding people. We get the expressions of the expected return under the two strategies and choose the strategy according to the principle of the maximum expected return. Then the average arrival intensity of queuing passengers is calculated by the specific data, and then the real-time data flow of queuing passengers is simulated. The random decision-making model is verified, in which the accuracy rate of flight peak decision-making reaches 100%, the accuracy rate of middle peak decision-making reaches 73.8%, and the accuracy rate of low peak decision-making reaches 91.9%. In addition, the impact of waiting volume in the storage pool, the number of people arriving in the queue per hour and other factors on the average waiting time of taxis is also plotted. It is found that the waiting volume in the storage pool has a more significant impact on the waiting time. Finally, the paper analyzes the sensitivity of the waiting number of the variable storage pool in the stochastic decision-making model, and finds that the waiting number of the storage pool is more sensitive to the stochastic decision-making model, while the distribution of the number of passengers is not sensitive to the stochastic decision-making model.
Keywords: Airport taxi scheduling; Principle of maximum profit; Stochastic decision model; Sensitivity analysis
Introduction
The rapid economic growth and globalization have stimulated the growth of the demand for air passenger transport in China. With the popularity of air travel mode, the throughput of tourists has entered a period of high-speed growth, which tests the traffic support capacity of the road sections around the airport [1]. As a flexible means of transportation, taxi plays an important role in the transportation of airport passengers [2]. The study of taxi capacity demand, decision-making effectiveness in different situations, and reasonable allocation of taxi resources can not only improve the personal benefits of taxi drivers, airport transportation capacity, solve the problem of passenger detention, and improve the efficiency of passenger taxi queuing. Moreover, it can be extended to the scheduling analysis of other means of transportation to provide valuable reference for efficient travel.
Taxi drivers taking passengers to the airport will be faced with two choices: A. Go to the arrival area and wait in line for passengers to return to the city. The length of waiting time depends on the number of taxis and passengers in line, which requires a certain time cost. B. Directly empty and return to the urban area. Taxi drivers will pay no-load costs and may lose potential passenger income [3]. The number of flights arriving in a certain period of time and the number of vehicles already in the "car storage pool" are certain information that can be observed by the driver [4].
We need to build a model to solve the following problems: analyze and study the influencing mechanism of factors related to taxi driver decision-making, comprehensively consider the changing law of airport passenger number and the income of taxi driver, build a decision-making model for taxi driver selection, and give the driver selection strategy. On the basis of relevant data, the rationality of the model and its dependence on relevant factors are analyzed.
Analysis and research
From a subjective point of view, the driver will take into account the waiting time for parking in scheme A and the length of empty return time in scheme B. the time for empty return to the city is fixed, and the waiting time depends on whether the arrival time of the taxi belongs to the peak, medium peak, or low peak period, and also depends on the amount of vehicles in the storage pool.
From an objective point of view, to quantify the time cost and benefit of the two schemes, we establish the calculation model of the two schemes' benefit. Then calculate the benefits of the two schemes according to the data [5]. Finally, according to the principle of efficiency optimization, the decision-making is carried out and the scheme with high income is selected. The specific benefits of the two schemes are analyzed as follows:
For both schemes provided that:
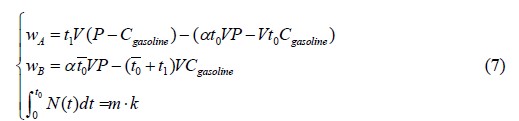
Based on the above constraints, the income functions of the two schemes in the same time t1 +t0 are obtained respectively, and then substituted into the known parameters for comparison, so as to give the optimal decision of the driver. The core lies in the establishment of revenue function of the two schemes, and the key lies in the determination of taxi waiting time in scheme A. The time allocation diagram of the two schemes is shown in Figure 1.
If option A is selected, the driver can neither gain profit nor lose the cost of fuel consumption during the period t0 of parking and waiting. The only profit is the fare paid by the passenger minus the fuel consumption during the period t1 of carrying passengers back to the city [6].
If option B is selected, in order to ensure the rationality and fairness of decision-making, considering that there is a waiting time t0 before the driver returns to the urban area in option A, the premise of comparing the benefits of two options is that the time taken to implement option B should be the same as that of option A. Then the income of scheme B is the income of pulling passengers in the urban area in time t0, and the cost is the fuel consumption cost in the period t0 + t1 of pulling passengers back to the urban area.
By using the above analysis, we can get the decision model and give the correct strategy. Collect the relevant data of taxis in an airport and its city in China, on the basis of theoretical modeling and analysis, make corresponding decisions by substituting real data to serve real life, and analyze the dependence of relative factors according to the decision-making process and results [7,8]. Finally, we need to reverse verify our decision results. In the verification, we can select as many t0¢ values as possible on the Poisson distribution function corresponding to t0 on the same time node, get multiple groups of results, and select the scheme [9]. Finally calculate the proportion of decision consistent with decision function which we directly use t0 into decision function to evaluate the rationality of this model.
Stochastic decision model
We analyzed the influencing mechanism of taxi drivers' decision-making related factors and established a stochastic decision-making model. Considering the changing rules of airport passenger quantity and taxi driver's income synthetically, the decision-making income functions of two schemes A and B are established, and the decision variables are solved. Finally, the decision is made according to the principle of the best benefit.
Establishment of income function: By analyzing the working characteristics of taxi drivers, it can be seen that the time-based card charging mode is widely used in taxi charging, and the revenue is P (km / yuan) and the cost is Cgasoline (km / yuan). It is assumed that there is no fuel consumption cost when the taxi stops and waits at the airport, and the time that the driver can carry passengers in the urban T-period is aT (a<1) and the time that the driver takes to return to the urban area is the same as the time that the empty car takes to return to the urban area is t1 [10]. Firstly, it is assumed that if scheme A is selected, the waiting time to be experienced is t0 which is related to the rule of the number of people at the exit and the number of vehicles queuing in front of the taxi. In order to ensure the rationality and fairness of the decision, considering that there is a period of waiting time for the driver in scheme A before returning to the urban area, this paper defines the premise criterion for calculating the benefit: the time for implementing scheme B should be the same as that for scheme A which is t0+t1, and then the benefit functions of the two schemes are obtained.
Then the benefits of this scheme are:


We analyze all the waiting situations, first of all, there are two categories: the first category is that the number of passengers in line is greater than or equal to the number of passengers carried by vehicles; the second category is that the number of passengers in line is less than the number of passengers carried by vehicles (the first category is that the growth rate of the number of passengers in line is greater than that of vehicles, and the second category is that the former is less than the latter). According to the analysis of the number of outbound passengers in real life, we can only infer the number of passengers waiting for taxis at the exit in a large time interval through the flight information [13]. But in real life, we can see that from the terminal to the exit, passengers will delay part of the time due to baggage collection and other matters, and this time is used to speculate the growth of queuing passengers N(t) obey Poisson distribution [14]. We put its expression into the taxi queuing process so that the waiting time can be calculated. We put all possible growth data (obeying Poisson distribution) into the process to calculate the average waiting time.
After calculating the average waiting time, the other relevant parameters are substituted into the income function to calculate the income of the two schemes, and the scheme with larger income is selected by comparison, and the optimal strategy of the driver is given.
Decision variable: waiting time of scheme A: As shown in Figure 2, it is shown that the determination of waiting time of drivers depends on two dynamic change processes. One is the change of the number of passengers at the exit. It is objectively analyzed that the change of the number of passengers at the exit is affected by many factors, such as weather, flight information, the time of passengers staying in the crew hall, whether to pick up luggage [15]. The other is the total number of taxis queuing in front of the taxi. Because the number is fixed and the value is the information that every driver can get, it is not discussed here, and it is set as a constant.
Assuming that N (t) satisfies the above conditions, the number of people arriving at a certain time node (small time period) obeys Poisson distribution, from another point of view, the parameter li of Poisson distribution reflects the impact of flight information, weather and other comprehensive factors on the growth of queue number at this point, that is, N (t) is Poisson flow.
As for the solution of this Poisson distribution function, since we know that the number of people waiting at the exit in a certain period of time is C, according to the properties of Poisson distribution, li reflects the average number of people growing at this point of time, so we can disperse C to each node in this period through the mathematical mean, Then the parameter li of
Poisson distribution function corresponding to each time node is obtained, and the Poisson distribution law of each time node N (t) is obtained:

According to Eq. (3), the number of people at the exit varies with time. If there are a total of taxis waiting in the queue ahead, the waiting time can be divided into the following situations:
a) When N (t) ³ m0 × k (peak).
In this case, the waiting time is the product of the number of vehicles ahead and the time for each vehicle to pick up passengers: t0 = nm.
b) When N0 < m0 × k, at this time, it is necessary to compare the growth number of people at the exit at each time 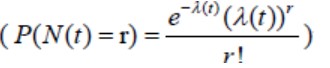
with the number of people per unit time of taxi, which can be further divided into the following two types:
1) When N (t) ³ C unit (medium peak period), the waiting time is the product of the number of vehicles ahead and the time for each vehicle to pick up passengers:

2) When N(t) < Cunit (low peak period), the waiting time is equal to the total number of people at the exit from this moment and the total number of people that can be loaded by the vehicles in front of the queue, the integral knowledge can be used to solve the problem. The formula is as follows:

Through the above deduction, we can determine the mean value of the growing population at a certain time through the Poisson distribution function. Since the waiting time t0 depends on N¢(t), according to the properties of the distribution function, we can infer that the final t0 determined at each moment is also obey Poisson distribution. The decision is made on the basis of the average waiting time calculated according to this distribution function. Finally, is substituted into the income function of scheme A and scheme B  espectively, is the best scheme in the mean state.
Decision model Objective function:
Objective function:

According to Equation (6) and (7), the selection strategy of taxi drivers can be obtained.
Model verification
We get the flight information data of Wuhan Tianhe Airport through the network resources, which can be divided into three cases: peak period, medium peak period and low peak period. We solve the relevant parameters and choose the scheme respectively. The three-dimensional graph of waiting time, the number of vehicles in the storage pool and the number of people waiting in the time period are drawn [19]. According to the graph, the main influencing factors are analyzed. Finally, the rationality of the model is verified.
Airport data collection: Through Internet resources, we can obtain variables such as the capacity of the car storage pool of Wuhan Tianhe Airport during the peak period, the number of vehicles queued at any time, the number of people queued at any time, and the average passenger flow per hour of the airport on July 1, 2019 [20,21]. As shown in the Figure 3 below is a line chart drawn according to its flight information data.
Model parameter determination: Calculate lˆ value from Poisson distribution for passenger numbers at different times:
If the time granularity is Dt1 minutes, there are  time granules in one hour. In Figure 4, the sum of all rectangular areas is N (t) and its Poisson distribution parameter is lˆ. The parameter lˆ satisfies the formula:
  which means that the corresponding lˆ can be obtained by substituting N (t) in peak, middle peak and low peak periods. The results are shown in Table 1.
Stochastic decision model solution: Using the established stochastic decision model, the parameters determined in the above steps are substituted to solve the problem.
Solution results: These parameters are substituted into Eq. (7) to calculate the benefits of scheme A and scheme B in peak period, medium peak period and low peak period respectively. Compare the values of wA and wB: if wA > wB, the taxi driver should choose to wait. If wA < wB, the driver should choose to return to the city empty immediately. The specific values and decision-making options are shown in Table 3.
Analysis of influencing factors: We will traverse the collected data and divide the time into peak, medium peak and low peak periods according to the number of flights. The initial number of vehicles and the number of passengers per hour in the storage pool are the most intuitive two data. This paper mainly explores the dependence of the selection strategy on the two data [22,23]. The number of passengers in different periods obeys Different Poisson distribution. Now we know the real number of passengers in queue at a certain time. If we choose the right time granularity and time node, we can get the value of the number of passengers in different times [24]. Then the parameters are put into the queuing process to analyze and calculate the waiting time, and the dependence function of factors on the waiting time can be obtained. In the selection strategy, the waiting time is the key of decision-making [24]. so the dependence of factors on the waiting time can be regarded as the dependence on the selection strategy. The above algorithm is used to calculate the change rule of average waiting time of taxis in Tianhe Airport at different times of the whole day on July 1, 2019 under the condition of the change of passengers per hour and the change of initial vehicles, as shown in Figure 5.
The dependence of the average waiting time on the number of passengers per hour and the number of initial vehicles is shown in Figure 5. When the number of passengers per hour is more, the waiting time of taxi is shorter, and the number of initial vehicles is more, the average waiting time of taxi is longer. According to the dependence of selection strategy on waiting time, the dependence of selection strategy on the above two factors can also be obtained. Similarly, the waiting time of the three periods of peak, medium peak and low peak depends on the initial vehicles in the storage pool and the number of passengers per hour, as shown in Figure 6-8 respectively.
It can be seen from the above three figures that: the average waiting time increases with the increase of the initial number of vehicles in the storage pool; the average waiting time decreases with the increase of the number of passengers per hour. And the impact of the initial number of vehicles in the storage pool on the average waiting time of taxis is greater than the impact of the number of passengers per hour. Therefore, for taxi drivers, a small number of initial vehicles in the storage pool will lead to less average waiting time
Test of model result: Because N(t) conforms to Poisson distribution, according to the transfer effect, the waiting time of option a calculated at a certain time node also conforms to Poisson distribution, t0 is the mean value of the corresponding Poisson distribution function, and our decisions on the optimal scheme are all based on t0. When verifying this decision method, we respectively substitute 1000 points on the Poisson distribution function in peak period, middle peak period and low peak period into the decision function (Equation (6) and (7)) for scheme selection, and get three groups of results, as shown in Table 4.
The probability that the peak period is consistent with the decision we made by directly substituting  into the decision function is 100% higher, the middle peak period is also 73.8%, and the low peak is as high as 91.9%, indicating that this method has passed the verification and our model is reasonable.
Sensitivity analysis
From the stochastic decision model established in this paper, the function relationship between the average waiting time and each parameter can be obtained.
Sensitivity analysis of vehicle volume waiting in car storage pool: According to the random decision model established in this paper, the functional relationship between the average waiting time and each parameter can be obtained as shown in Figure 5-8. Among them, the waiting volume of the storage pool is a significant factor affecting the model. Now, adjust the waiting volume N0 of the storage pool according to ± 5% and ± 15% respectively to get N0 = 50, 60, 70, 80, and keep other parameters unchanged. Execute the random decision model again to get the corresponding new functional relationship. The functional diagram is as shown in Figure 9.It can be seen from the image that the waiting vehicle volume of the storage pool is more sensitive to the stochastic decision model.
Sensitivity analysis on the number of passengers at the exit: In the same way as the sensitivity analysis of parameter N0, we assume that the number of passengers at the exit is subject to normal distribution and uniform distribution, and other parameters remain unchanged. Re execute the random decision model to get the image as shown in Figure 10.
It can be seen from the image that the distribution of the number of passengers is not sensitive to the stochastic decision model.
Conclusion
In this paper, from the perspective of taxi drivers and airport managers, the random decision model is used to analyze and answer the airport taxi scheduling problem in detail. We analyzed the influencing mechanism of taxi drivers' decision-making factors and established a stochastic decision-making model. By introducing the revenue function and the probability calculation model of the average waiting time, the expected revenue expressions under the two strategies are obtained and the strategies are selected according to the principle of maximum expected revenue. The selection strategy is not only limited to the number of vehicles and people queuing at a certain time point, but also a scheme to get the optimal income by analyzing the dynamic parameter change law. Moreover, the strategy in this paper can be used to decide the taxi queuing problem at any airport at any time only by adjusting the parameter value. Based on the data of all day flight of Tianhe Airport in Wuhan, China, the decision results of peak, medium peak and low peak of flight, as well as the situation of more, medium and less waiting in the car storage pool are solved by using the stochastic decision model. The correct rate of decision-making is 100% in peak, 73.8% in medium peak and 91.9% in low peak. The three-dimensional graphs of waiting time, the number of vehicles in the storage pool and the number of people waiting in the time period are drawn. According to the graphs, the main influencing factors are analyzed and the rationality of the model is verified.
Finally, the paper analyzes the sensitivity of the number of vehicles waiting in the variable storage pool and the number of passengers at the exit in the stochastic decision-making model, and finds that the number of vehicles waiting in the storage pool is more sensitive to the stochastic decision-making model, while the distribution of the number of passengers is not sensitive to the stochastic decision-making model.
Acknowledgement
This work was supported by the Philosophical and Social Sciences Research Project of Hubei Education Department (19Y049), and the Staring Research Foundation for the Ph.D. of Hubei University of Technology (BSQD2019054), Hubei Province, China.
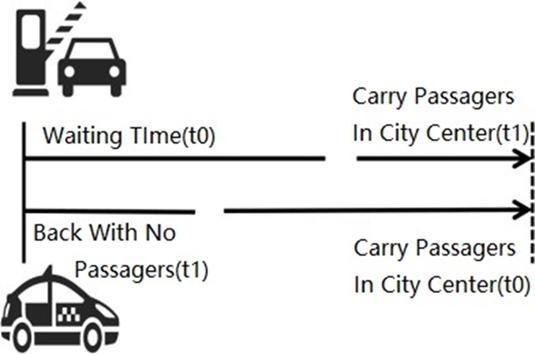
Figure 1: Control diagram.
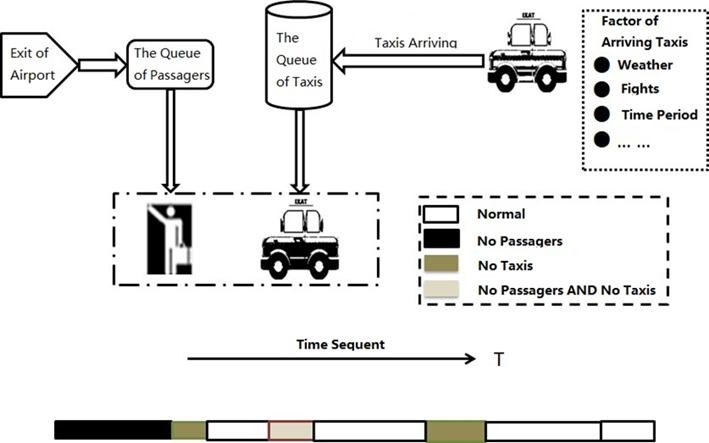
Figure 2: Taxi transportation process.
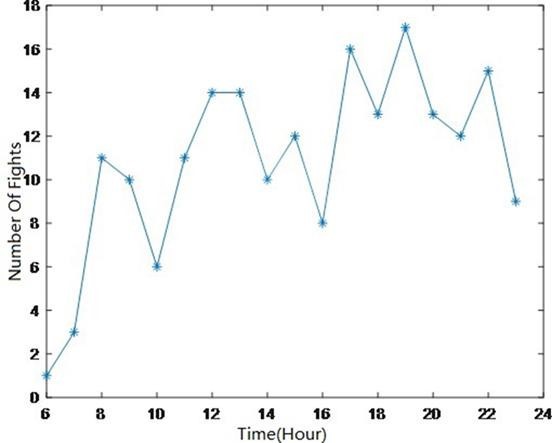
Figure 3: Shift timing diagram.

Figure 4: Time granularity chart.
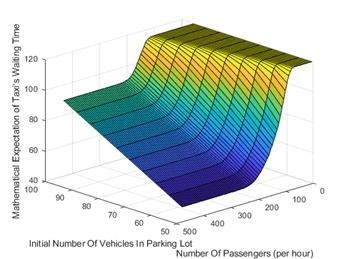
Figure 5: Change rule of taxi waiting time.
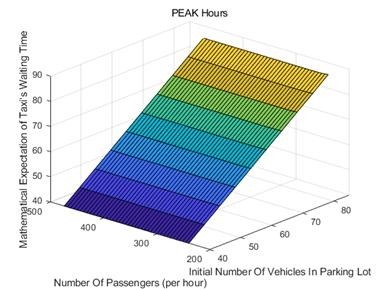
Figure 6: Factor dependence diagram of peak period.
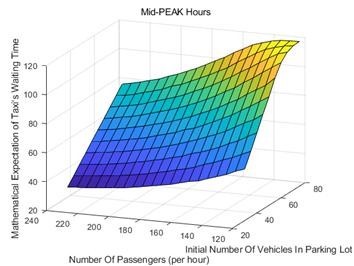
Figure 7: Factor dependence diagram of medium peak period.
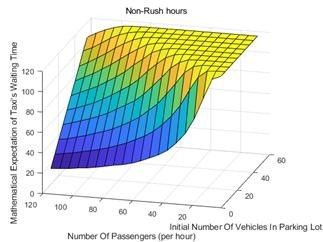
Figure 8: Factor dependence diagram of low peak period.
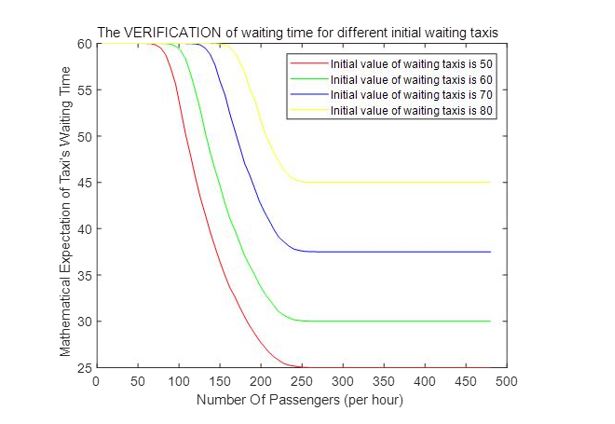
Figure 9: Sensitivity analysis diagram of vehicle volume waiting in car storage pool.
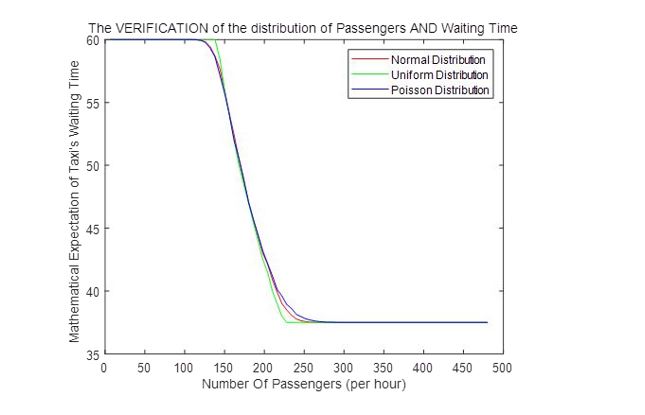
Figure 10: Sensitivity analysis diagram of number of passengers at exit.
Citation: Cao J and Zhao B (2020) Bio statistical Analysis of Taxi Scheduling based on Stochastic Decision Model. Emerg Infect Dis Diag J: EIDDJ-1002939019