
Open Access Journal of Agriculture Research
(ISSN 2651-9003)
Research Article
Modeling the Growth Curves of Selected Fulani Ecotype Chickens
Ogunshola OJ1*, Morenikeji OB2 and Chineke CA3
The Federal University of Technology, Ondo State, Nigeria
*Corresponding author: Olawale Jacob Ogunshola, The Federal University of Technology, Ondo State, Nigeria, Tel: +2348032321183; Email: ojogunshola@futa.edu.ng
Citation: Ogunshola OJ, Morenikeji OB, Chineke CA (2020) Modeling the Growth Curves of Selected Fulani Ecotype Chickens. Modeling the Growth Curves of Selected Fulani Ecotype Chickens. Open Acc J Agri Res: OAJAR-100028
Received date: 17 Febraury, 2020; Accepted date: 07 March, 2020; Published date: 18 March, 2020
Abstract
Background: This study was carried out to monitor the growth of selected Fulani ecotype chickens (FEC) using different models with the view of identifying the model that best describe the growth of the bird based on their sex, polydactylism and rearing system. Ninety day-old Fulani ecotype chicks were raised to 26 weeks. Body weight was recorded on weekly basis.
Results: It was revealed that the coefficient of determination (R2) ranges from 0.984- 0.998 for male FEC across the Brody, Gompertz, Logistic, Richards, Bridges and Janoschek models but ranges from 0.990-0.999 in female except for Logistic model with the lowest value of 0.163. All the models for Polydactyl FEC gave R2 of 0.982-0.999 with an exception of Logistic with lowest value of 0.161. The non-polydactyl FEC recorded R2 values of 0.988-0.998 across the six models. R2 values of 0.984-0.999 were recorded for both caged and deep litter FEC while Logistic model recorded low values of 0.153 and 0.170.
Computational difficulty (CD) or number of iteration ranges from 5-11, 5-38, 8-100, 8-12, 6-32 and 5-100 for sexes, polydactylism and rearing systems across all models. Highest values of CD were found in Logistic models. Across all models, Mean Square Error (MSE) obtained ranges from 1443.4-4140, 1107.2-1443.4, 930.3-3484.6, 1382.8-1961.1, 1166.5-1909.0 and 1617.6-2960.6 for both sexes, polydactylism and rearing systems. There were variation in the values derived for asymptotic growth (a), constant of integration (b), rate of maturity (k) and inflection point (m) butthe estimate of m (inflection point) was constant (0.05 ± 0.00) for Richards, Bridges and Janoschek models.
Conclusion: It was concluded that Gompertz model was the best suited to model the growth curves of Fulani ecotype chickens for both sexes, polydactylism and rearing systems.
Keywords: Chicken; Fulani ecotype; Growth curve; Polydactylism; Rearing system
Abbreviations
CD : Computational Difficulty or number of iteration
FEC : Fulani Ecotype Chickens
MSE : Mean Square Error
R2 : Coefficient of determination
Introduction
The native chicken constitutes about 80 percent of the 120 million poultry birds found in Nigeria (Federal Ministry of Agriculture and Rural Development, 2006). The indigenous chickens evolved through thousands of years of natural selection. They are well adapted to the local climatic conditions, feed and stress, with resistance to diseases. Though their peculiar extensive system of management is characterized by low input and corresponding low output, they provide food security, protein nutrition and women empowerment to the rural families besides alleviating poverty in developing countries [1]. Their wide distribution in villages demonstrates the importance of these small and easily managed farm animals. Large variations were reported to exist among the indigenous birds in conformation, plumage colour, immune response to various antigens, growth and reproductive performance [2-5]. This led to the conclusion that the indigenous chickens are repositories of unique genes that could be used in other parts of the world [6], hence the need for their conservation to keep genetic variation within and between local breeds. Major genes of chicken are believed to confer not only adaptability to the tropical climate, but also resistance to diseases [7-9] reported that the relationship existing among body characteristics provide useful information on performance, productivity and carcass characteristics of animals and these quantitative measure of size and shapes are necessary for estimating genetic parameters in animal breeding programmes. Polydactylism is the manifestation of an additional 1 to 2 digits in the foot. The genetic cause of these extra digit formation has been shown to be a single nucleotide polymorphism (SNP) in a regulator of the sonic hedgehog gene (SHH) called the zone of polarizing activity (ZPA) and zone of regulatory sequence (ZRS) [10]. The genetic erosion of these indigenous breeds may lead to the loss of valuable genetic variability in specific characteristics that are momentarily unimportant in commercial breeding strategies [11].
Modeling growth curves of animals is an important tool for optimizing the management and the efficiency of animal production. It is obvious that growth modeling has many advantages for domestic animals [12]. As a consequence, many studies dealing with modeling of growth curves for pigs [13], cattle [14-16] and poultry [15] have been conducted. In the last few years it has become more and more popular to also analyze the growth of special livestock, e.g., the Bilivian llama [16], pearl gray guinea fowl [17], Goettingenminipig [18] and the dog [19], in order to provide improvement for their husbandry. Coefficients of determination (R2) values have been used to evaluate the fit of the models in some studies [20]. The models that gave the highest R2 with low iteration number or mean square error values have been accepted as the best fitting models.
Materials and Methods
Location of the study: The experiment was carried out at the Poultry Unit of the Teaching and Research Farm of Federal University of Technology Akure, Nigeria. This site is geographically located between latitude 7°5’N and longitude 5°15’E at an altitude of 370m above sea level [21]. The vegetation of the area is that of the Rainforest characterized by hot and humid climate. The annual rainfall is about 1500 mm and the rain pattern is bimodal which begins in March and ends in mid-October, with a little dry spell or short break in August traditionally referred to as “August break”. The mean annual relative humidity is 75% and the range value for ambient temperature is about 30-32°C.
Experimental birds/management of birds: Ninety day-old Fulani ecotype chicks were collected from a reputable farm and brooded under intensive management system for 8 weeks, sexed and assigned at random into 2 rearing systems (cage and deep litter) containing 45 polydactyl and 45 non-polydactyl which were raised to 26 weeks. Each treatment (rearing system) was replicated 5 times with 9 birds per replicates. All the experimental birds were fed with commercial feeds (chick phase: 2800 ME/kg and 23% CP; grower phase to adult phase: 3200 ME/kg and 18-21% CP) to 26 weeks old and also provided with fresh water.
Data Collection: Measurements of body weight were carried out every week (Saturdays). The body weight was measured in gram using electronic sensitive scale (sensitivity to 5 g) and top loading Balance (20 kg capacity).
Growth Models and Data Analyses: To estimate the body weight at a certain age, three 3-parameters (Brody, Gompertz, Logistic) and three 4-parameters (Richards, Bridges and Janoschek) nonlinear growth functions were fitted for the measurements of live weights related with age via NLIN (non-linear) procedure of SAS software (SAS 9.2, Version 2008).
Where: W=body weight at time t, a=mature body weight, e=exponential, t=age in weeks
b, k and m=parameters specific for the functions.
Statistics that were used to determine the goodness of fit for the models are:
Results
The growth curves (age-weight relationship) of Fulani ecotype chickens with respect to sex, polydactylism and rearing systems are illustrated in (Figure 1-3) respectively. The Brody, Gompertz, Richards, Bridges and Janoschek fitted the age-weight data well with the R2 (coefficients of determination)values ranging from 0.984 to 0.998 for the Male Fulani ecotype chickens (Table 2). The Brody, Gompertz, Richards, Bridges and Janoschek fitted the age-weight data well with the R2 values ranging from 0.990 to 0.999 while Logistic model had the lowest R2 value of 0.163 for the female Fulani ecotype chickens. Among the polydactyl Fulani ecotype chickens, the Brody, Gompertz, Richards, Bridges and Janoschek fitted the age-weight data well with the R2 values ranging from 0.990 to 0.999 while Logistic model had the lowest R2 values ranging from 0.982 to 0.999 while the Logistic model had the lowest R2 value of 0.161. For the non-polydactyl Fulani ecotype chickens, all the six models fitted the age-weight data well with R2 values ranging from 0.988 to 0.998. The Brody, Gompertz, Richards, Bridges and Janoschek fitted the age-weight data well with the R2 values ranging from 0.984 to 0.998 while Logistic model had the lowest R2 value of 0.170 for the caged Fulani ecotype chickens.
The Brody, Gompertz, Richards, Bridges and Janoschek fitted the age-weight data well with the R2 values ranging from 0.984 to 0.998 while Logistic model had the lowest R2 value of 0.153 for the deep litter Fulani ecotype chickens. The lowest mean square error (MSE) were found in male Fulani ecotype chickens for Janoschek (1443.4) while Brody, Logistic, Gompertz, Richards and Bridges provided high MSE values ranging from 2218.9 to 4140.0. The same MSE values were derived for Logistic and Gompertz (2218.9) and the same MSE values were also recorded for Brody, Richards and Bridges (4140.0) among the male Fulani ecotype chickens. The best and same mean square error were found in female Fulani ecotype chickens for Brody and Gompertz (1138.5) followed by Logistic (1169.8), Bridges (1443.4) and Janoschek (1443.3) that had better MSE values than Richards (1677.2). The lowest mean square error were found in polydactyl Fulani ecotype chickens for Gompertz and Richards (955.9 and 930.3) followed by Logistic (1639.6) but high MSE values were found in Brody, Bridges and Janoschek that gave the same value of 3484.6. The best mean square error were found in non-polydactylous Fulani ecotype chickens for Gompertz (1382.8) followed by Logistic and Richards with the same MSE value of 1826.5 better than Brody, Bridges and Janoschek that provided same MSE value of 1961.1. The best mean square error were found in caged Fulani ecotype chickens for Gompertz (1166.5) followed by Logistic (1313.6), Richards (1718.8), Brody (1909.0), Bridges (1909.0) and Janoschek (1909.0) respectively. The best mean square error were found in Fulani ecotype chickens under deep-litter rearing system for Logistic (1617.6) while the Gompertz, Richards, Brody, Bridges and Janoschek provided high MSE values of 2065.5, 2494.4, 2960.6, 2960.6 and 2960.6 respectively.
The Brody, Gompertz, Logistic, Richards, Bridges and Janoschek models gave the iteration number for the male Fulani ecotype chickens ranging from 5-15 while the female Fulani ecotype chickens ranged from 5-11 except for logistic that gave the poorest iteration number of 38. The Brody, Gompertz, Richards, Bridges and Janoschek ; for the polydactyl Fulani ecotype chickens gave an iteration number that ranged from 8-11 and logistic gave the poorest iteration number of 100 while all the models gave iteration number of 8-12 for the non-polydactyl Fulani ecotype chickens. The Brody, Gompertz, Richards, Bridges and Janoschek growth functions recorded the best iteration number of 6 to 11 for caged Fulani ecotype chickens while Logistic showed the poorest iteration value of 32. The Brody, Gompertz, Richards, Bridges and Janoschek growth functions also recorded the best iteration number of 5 to 11 while logistic gave the poorest iteration value of 100 for the Fulani ecotype chickens under deep-litter system of rearing.
The estimated model parameter means and standard errors obtained with Brody, Gompertz, Logistic, Richards, Bridges and Janoschek models are shown in Table 3. The Bridges function gave the best description of parameter ‘a’ (asymptotic weight parameters) among male Fulani ecotype chickens, recording the highest value of 2427.40 ± 199.30 followed by Brody and Janoschek (2272.40 ± 229.00), Gompertz (1604.30 ± 36.50), Logistic (1497.30 ± 25.39) and Richards (1497.30 ± 25.39) in decreasing order. The Bridges function gave the best description of parameter ‘a’ among female Fulani ecotype chickens, recording the highest value of 1630.60 ± 66.78 followed by Brody and Janoschek (1532.00 ± 82.41), Gompertz (1233.70 ± 26.33), Richards (1166.70 ± .77) and Logistic (775.80 ± 68.41) in decreasing order. The Bridges function gave the best description of parameter ‘a’ among the polydactyl Fulani ecotype chickens, recording the highest value of 1758.60 ± 63.02 followed by Brody and Janoschek (1569.30 ± 80.31), Gompertz (1326.10 ± 16.94), Richards (1275.10 ± 12.35) and Logistic (893.20 ± 82.65) in decreasing order.
The Bridges function gave the best description of parameter ‘a’ among the non-polydactyl Fulani ecotype chickens, recording the highest value of 1868.00 ± 111.50 followed by Brody and Janoschek (1769.20 ± 131.40), Gompertz (1339.10 ± 32.96), Richards and Logistic (1253.30 ± 24.63) in decreasing order. The Bridges function gave the best description of parameter ‘a’ among the caged Fulani ecotype chickens, recording the highest value of 1617.60 ± 55.60 followed by Brody and Janoschek (1484.00 ± 70.90), Gompertz (1329.80 ± 27.13), Richards (1183.40 ± 19.09) and Logistic (812.70 ± 73.98) in decreasing order. The Bridges function gave the best description of parameter ‘a’ among the Fulani ecotype chickens under deep-litter rearing system, recording the highest value of 1921.60 ± 132.60 followed by Brody and Janoschek (1807.00 ± 156.30), Gompertz (1373.00 ± 38.69), Richards (1289.00 ± 27.21) and Logistic (843.10 ± 83.86) in decreasing order. The estimate of b (constant of integration) as shown in Table 3 for Brody function was constant among the male Fulani ecotype chickens, followed by the female, non-polydactyl and deep-litter Fulani ecotypes chickens with a constant estimate of ‘b’ as 1.06 ± 0.02. The caged Fulani ecotype chickens gave an estimate of ‘b’ as 1.09 ± 0.03 while the polydactyl gave the highest estimate of ‘b’ as 1.12 ± 0.04.
The Gompertz function gave the negative estimate of ‘b’ among the male Fulani ecotype chickens as -3.67 ± 0.18, female Fulani ecotype chickens as -3.09 ± 0.17, polydactyl Fulani ecotype chickens as -3.82 ± 0.22, non-polydactyl Fulani ecotype chickens as -3.17 ± 0.19, caged Fulani ecotype chickens as -3.27 ± 0.18 and the deep-litter Fulani ecotype chickens as -3.30 ± 0.23 indicating slow growth rate. The Logistic function gave the negative estimate of ‘b’ among the male Fulani ecotype chickens as -14.31 ± 1.70, female Fulani ecotype chickens as -4.65 ± 7.26, non-polydactyl Fulani ecotype chickens as -10.80 ± 1.25, caged Fulani ecotype chickens as -3.27 ± 0.18 and positive estimate of ‘b’ for deep-litter Fulani ecotype chickens as 5.78 ± 4.60 and polydactyl Fulani ecotype chickens as 1.19 ± 7.01.
The Richards function gave the estimate of ‘b’ among the male Fulani ecotype chickens as 14.31 ± 1.70, female Fulani ecotype chickens as 10.04 ± 1.18, polydactyl Fulani ecotype chickens as 14.50 ± 1.40, non-polydactyl Fulani ecotype chickens as 10.80 ± 1.25, caged Fulani ecotype chickens as 11.12 ± 1.40 and the deep-litter Fulani ecotype chickens as 11.71 ± 1.61.
The Bridges function gave the estimate of ‘b’ among the male Fulani ecotype chickens as -154.60 ± 48.24, female Fulani ecotype chickens as -98.68 ± 29.88, polydactyl Fulani ecotype chickens as -189.50 ± 49.29, non-polydactyl Fulani ecotype chickens as -98.87 ± 33.74, caged Fulani ecotype chickens as -133.60 ± 35.59 and the deep-litter Fulani ecotype chickens as -114.10 ± 41.74. The Janoschek function gave the estimate of ‘b’ among the male Fulani ecotype chickens as -154.60 ± 48.24, female Fulani ecotype chickens as -98.68 ± 29.88, polydactyl Fulani ecotype chickens as -189.50 ± 49.29, non-polydactyl Fulani ecotype chickens as -98.87 ± 33.74, caged Fulani ecotype chickens as -133.60 ± 35.59 and the deep-litter Fulani ecotype chickens as -114.10 ± 41.74.
The Brody function gave the estimate of k (rate of maturity)among the male Fulani ecotype chickens as 0.05 ± 0.01, female Fulani ecotype chickens as 0.06 ± 0.01, polydactyl Fulani ecotype chickens as 0.08 ± 0.01, non-polydactyl Fulani ecotype chickens (0.05 ± 0.01), caged Fulani ecotype chickens (0.07 ± 0.03) and the deep-litter Fulani ecotype chickens as 0.05 ± 0.01. The Gompertz function gave the estimate of ‘k’ among the male Fulani ecotype chickens as 0.16 ± 0.01, female Fulani ecotype chickens (0.16 ± 0.01), polydactyl Fulani ecotype chickens (0.20 ± 0.01), non-polydactyl Fulani ecotype chickens (0.15 ± 0.01), caged Fulani ecotype chickens (0.16 ± 0.01) and the deep-litter Fulani ecotype chickens as 0.15 ± 0.01. The Logistic function gave the estimate of ‘k’ among the male Fulani ecotype chickens as 0.26 ± 0.01, female Fulani ecotype chickens (44.08 ± 0.00), polydactyl Fulani ecotype chickens (15.18 ± 5.98), non-polydactyl Fulani ecotype chickens (0.24 ± 0.01), caged Fulani ecotype chickens (19.17 ± 5.77) and the deep-litter Fulani ecotype chickens as 16.09 ± 79.66. The Richards function gave the estimate of ‘k’ among the male Fulani ecotype chickens as 0.13 ± 0.01, female Fulani ecotype chickens (0.12 ± 0.01), polydactyl Fulani ecotype chickens (0.15 ± 0.01), non-polydactyl Fulani ecotype chickens (0.12 ± 0.01), caged Fulani ecotype chickens (0.15 ± 0.01) and the deep-litter Fulani ecotype chickens as 0.12 ± 0.01.The Bridges function gave the estimate of ‘k’ among male Fulani ecotype chickens (0.10 ± 0.02), female Fulani ecotype chickens (0.12 ± 0.01), polydactyl Fulani ecotype chickens (0.16 ± 0.01), non-polydactyl Fulani ecotype chickens (0.11 ± 0.01), caged Fulani ecotype chickens (0.15 ± 0.01) and the deep-litter Fulani ecotype chickens as 0.11 ± 0.02. The Janoschek function gave the estimate of ‘k’ among the male Fulani ecotype chickens as 0.10 ± 0.02, female Fulani ecotype chickens (0.12 ± 0.01), polydactyl Fulani ecotype chickens (0.16 ± 0.01), non-polydactyl Fulani ecotype chickens (0.11 ± 0.01), caged Fulani ecotype chickens (0.15 ± 0.02) and the deep-litter Fulani ecotype chickens as 0.11 ± 0.02.
The estimate of m (inflection point) as shown in Table 3 was constant for Richards, Bridges and Janoschek functions (0.05 ± 0.00) among all the Fulani ecotype chickens.
Discussion
In this study, the Logistic growth functions recorded the lowest R2 values range of 0.153-0.170 for deep-litter, caged, female and polydactyl Fulani ecotype chickens; and also recorded higher R2 value of 0.998 for male and non-polydactyl Fulani ecotype chicken. This R2 values disagreed with the report of [22-25] who reported R2 values of 0.990 for Logistic model in the growth of indigenous male Venda chickens, and also disagreed with the findings of who reported R2 value of 0.996 for Logistic function in describing the growth of broiler chickens. The Brody, Bridges and Janoschek growth functions recorded higher R2 values range of 0.982-0.990 for the selected Fulani ecotype chickens, Richards growth function recorded R2 values range of 0.984-0.999 while Gompertz growth function recorded R2 values range of 0.990-0.999. This higher R2 values were in line with the report of [22] who reported R2 value range of 0.996-0.999 for Gompertz and Logistic growth function when comparing growth curves in slow growing chicken genotypes raised the organic system. The highest R2 value of 0.999 observed in the Gompertz growth function (for polydactyl and caged Fulani ecotype chickens) and in Richards growth function (for the female and polydactyl Fulani ecotype chickens) was in line with the report of who reported 0.999 as R2 value for Gompertz function in describing the growth of turkeys. Reporting similar observation in a comparison of models, [26] stated that, because of the observed R2 values were high and close to unity, it indicated a good overall measure of fitness.
The fitting of Brody, Gompertz, Logistic, Richards, Bridges and Janoschek growth functions presented no computational difficulty for all the selected Fulani ecotype chickens with respect to computing time. These functions attained convergence with low number of iterations ranging from 7-11 for male, female, polydactyl, non-polydactyl, caged and deep-litter Fulani ecotype chickens for Brody growth function. Gompertz growth function attained convergence with low number of iterations ranging from 11-15 for the Fulani ecotype chickens, Richards growth function attained convergence with low number of iterations ranging from 5-8, Bridges growth function attained convergence with low number of iterations ranging from 5-9, Janoschek growth function attained convergence with low number of iterations ranging from 5-10 except for Logistic function which converge at a relatively long computing time with the iteration number ranging from 5-100. This result disagreed with the report of [27], who reported an iteration number of between 5-10 for Gompertz, Logistic and Richards functions in modeling the growth curve of broiler chickens fed corn bran. Lopez de [28] stated that the lack of convergence in some individuals is indicative of lack of usefulness of the function involved in the study because the model showed some limitations to fitting all the growth data satisfactorily.
The MSE value ranged from 930.3 to 4140.0 and the Janoschek was ranked first according to the lowest MSE value for male Fulani ecotype chickens, followed by Gompertz and Logistic, while Brody, Richards and Bridges had the highest MSE value. Various MSE values have been found in the literature, depending on the model applied, the structure of dataset and the species of animal [29]. The MSE value reported in this study disagreed with the report of [30] who reported lower MSE values of 497.6 and 1137.5 for Logistic and Gompertz growth function in broiler chickens. The MSE value ranged from 1107.2 to 1443.4 and Richards model was ranked first according to the lowest MSE value for the female Fulani ecotype chickens, followed by the Brody and Gompertz; Logistic, Bridges and Janoschek while Richards had the lowest MSE value. The MSE value disagreed with the report of [31], who reported MSE value of 2240, 5924 and 1154 for Gompertz, Logistic and Richards models when modeling the growth curve of Venda chickens. The MSE value ranged from 930.3 to 3484.6 and the Richards growth function was ranked first according to the lowest MSE value for the polydactyl Fulani ecotype chickens, followed by Gompertz, then Logistic while the Brody, Bridges and Janoschek had the highest MSE value. The MSE value disagreed with the report of [32] who reported MSE value range of 497.6 to 1137.5 when modeling the growth curve of commercial broilers. The MSE value ranged from 1382.8 to 1961.1 and the Gompertz growth function was ranked first according to the lowest MSE value for the non-polydactyl Fulani ecotype chickens, followed by Logistic and Richards while the Brody, Bridges and Janoschek had the highest MSE value. The MSE value disagreed with the report of [33] who reported lower MSE value range of 42.5921 to 81.3210 for Logistic, Gompertz and Richards growth function in modeling the growth curves in a nondescript Italian chicken breed. The MSE value ranged from 1166.5 to 1909.0 and the Gompertz growth function was ranked first according to the lowest MSE value for the caged Fulani ecotype chickens, followed by Logistic, then Richards while the Brody, Bridges and Janoschek had the highest MSE value. The MSE value disagreed with the report of [34] who reported higher MSE value range of 67085.95 to 313900.94 for Von Bertalanffy, Logistic, Gompertz and Gauss growth functions in analyzing growth curves of turkeys reared in different breeding systems. The MSE value ranged from 1617.6 to 2960.6 and the Logistic growth function was ranked first according to the lowest MSE value for the deep-litter Fulani ecotype chickens, followed by Gompertz, then Richards while the Brody, Bridges and Janoschek had the highest MSE value. The MSE value disagreed with the report of [35] who reported lower MSE value range of 189.12 to 1130.16 for Gompertz and logistic growth function in modeling the growth curves in a nondescript Italian chicken breed.
The means and standard error of the parameter estimates for growth constants of each growth function were also used as a basis for comparison of the models.
The parameters for asymptotic weight (a), which is an estimation of the mature weight offered the best opportunity for direct comparison among all the models according to Lopez de [36,37]. Asymptotic weight parameter represented the maximum growth response for animals [38] and there were some differences between estimated asymptotic weight parameters for the models used in this study which disagreed with the report of [39] who reported higher range value of estimated asymptotic weight from 4839.86 to 5870.04 for logistic. Gompertz and Richards’s growth function in modeling the growth curves in a nondescript Italian chicken breed. Asymptotic weight was directly related with genotypic and environmental effects. The estimate of b (constant of integration) was positive for Brody and Richards growth function for the Fulani ecotype chickens except for Gompertz, Logistic, Bridges and Janoschek where negative values were recorded but positive values were recorded for deep-litter and polydactyl Fulani ecotype chickens under Logistic model. This result corroborated with the report of [40] who reported a negative ‘b’ value in chickens for Gompertz model.
Brody, Gompertz, Richards, Bridges and Janoschek gave the best value of k which is the rate of maturing [41] for the Fulani ecotype chickens. The Brody model gave the lowest estimate of ‘k’ while Logistic model gave the highest estimate of ‘k’ for female, polydactyl, caged and deep-litter Fulani ecotype chickens respectively. The smaller estimation of ‘k’ value indicated longer periods of growth and higher mature weights [42].
The Richards, Bridges and Janoschek models were four parameter models with a variable inflection point ‘m’ which is the point where the growth rate changes from increasing to a decreasing growth function [43]. The ‘m’ values of the Richards, Bridges and Janoschek models were constant (0.50 ± 0.00) for all the selected Fulani ecotype chickens. The constant point of inflection for these indigenous chickens indicated no genetic variation in the chickens but where there was variability of the point of inflection, it showed that there was genetic variation in the chickens [43].
Conclusion
The Gompertz model was found to be the best suited to model the growth curve of Fulani ecotype chickens for both sexes, polydactylism and rearing system showing higher R2 value, lower MSE and computational difficulty values while the Logistic model was found to be unsuitable. Brody, Gompertz, Logistic, Richards, Bridges and Janoschek models gave the best description of parameter ‘a’ which was the asymptotic weight and parameter ‘k’ which was the rate of maturity.
Acknowledgements
The authors will like to thank the Department of Animal Production and Health, Federal University of Technology Akure, Nigeria, for providing a suitable environmental site to carry out this project.
Authors’ contributions
CAC designed the study. All authors managed the activities of the experiment and interpreted the data collectively. OJO and CAC prepared the proposal of the study. Data curation by OJO. OJO and OBM did the formal analysis and prepared the first draft of the manuscript. CAC reviewed the first draft. All authors read and approved the final manuscript.
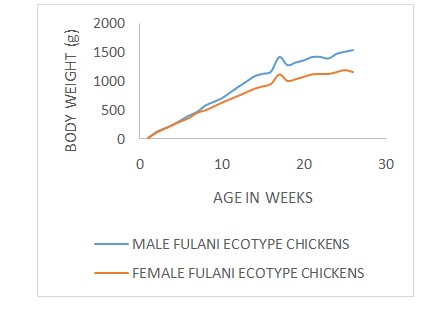
Figure 1: Male and Female FEC Growth curves.
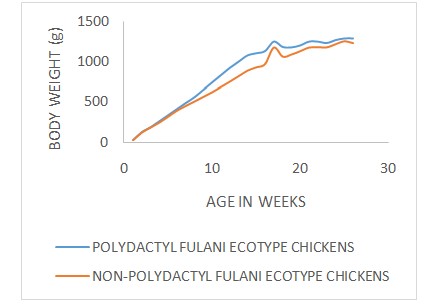
Figure 2: Polydactyl & Non polydactyl FEC Growth curves.
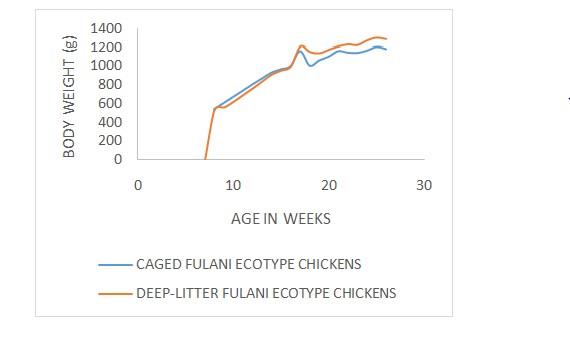
Figure 3: FEC Growth curves under deep litter and cage systems.
|
Model |
Expression |
No of parameters |
References |
|
Brody |
W=a x (1-b x e (-k x t)) |
3 |
(Fitzhugh, 1976) |
|
Gompertz |
W=a x e (b x e (-k x t)) |
3 |
(Gompertz, 1825) |
|
Logistic |
W=a / 1 + b x e (-k x t) |
3 |
(Fekedulegnet al., 1999) |
|
Richards |
W=a / (1 + b x e (-k x t)) 1/m |
4 |
(Fekedulegnet al., 1999) |
|
Bridges |
W=b + a x (1-e (-m x tk)) |
4 |
(Wellocket al., 2004) |
|
Janoschek |
W=a- (a-b ) x e(-k x tm) |
4 |
(Wellocket al., 2004) |
Table 1: Model Expressions.
|
Models |
Male |
Female |
Polydactyl |
Non Polydactyl |
Caged |
Deep Litter |
|
Brody |
||||||
|
R2 |
0.984 |
0.99 |
0.982 |
0.988 |
0.988 |
0.984 |
|
CD |
9 |
11 |
8 |
8 |
7 |
8 |
|
MSE |
4140 |
1138.5 |
3484.6 |
1961.1 |
1909 |
2960.6 |
|
Gompertz |
||||||
|
R2 |
0.998 |
0.999 |
0.999 |
0.998 |
0.999 |
0.998 |
|
CD |
15 |
11 |
11 |
11 |
11 |
11 |
|
MSE |
2218.9 |
1138.5 |
955.9 |
1382.8 |
1166.5 |
2065.5 |
|
Logistic |
||||||
|
R2 |
0.998 |
0.163 |
0.161 |
0.998 |
0.17 |
0.153 |
|
CD |
5 |
38 |
100 |
12 |
32 |
100 |
|
MSE |
2218.9 |
1169.8 |
1639.6 |
1826.5 |
1313.6 |
1617.6 |
|
Richards |
||||||
|
R2 |
0.984 |
0.999 |
0.999 |
0.998 |
0.998 |
0.997 |
|
CD |
6 |
5 |
8 |
8 |
8 |
8 |
|
MSE |
4140 |
1107.2 |
930.3 |
1826.5 |
1718.8 |
2494.4 |
|
Bridges |
||||||
|
R2 |
0.984 |
0.99 |
0.982 |
0.988 |
0.988 |
0.984 |
|
CD |
6 |
5 |
9 |
8 |
6 |
5 |
|
MSE |
4140 |
1443.4 |
3484.6 |
1961.1 |
1909 |
2960.6 |
|
Janoschek |
||||||
|
R2 |
0.99 |
0.99 |
0.982 |
0.988 |
0.988 |
0.984 |
|
CD |
10 |
5 |
9 |
8 |
8 |
8 |
|
MSE |
1443.4 |
1443.4 |
3484.6 |
1961.1 |
1909 |
2960.6 |
Table 2: Coefficient of determination (R2), Computational Difficulty (CD) and Mean Square Error (MSE) for the Fulani ecotype chickens.
|
Growth Models |
Male |
Female |
Poly |
Non-Poly Dactyl |
Caged |
Deep Litter |
|
|
Dactyl |
|||||||
|
Brody |
a |
2272.40 ± 229 |
1532.00 ± 82.41 |
1569.30 ± 80.31 |
1769.20 ± 131.40 |
1484.00 ± 70.90 |
1807.00 ± 156.30 |
|
b |
9.001.07 ± 0.02 |
1.06 ± 0.02 |
1.12 ± 0.04 |
1.06 ± 0.02 |
1.09 ± 0.03 |
1.06 ± 0.02 |
|
|
k |
0.05 ± 0.01 |
0.06 ± 0.01 |
0.08 ± 0.01 |
0.05 ± 0.01 |
0.07 ± 0.01 |
0.05 ± 0.01 |
|
|
Gompertz |
a |
1604.30 ± 36.50 |
1233.70 ± 26.33 |
1326.10 ± 16.94 |
1339.10 ± 32.96 |
1329.80 ± 27.13 |
1373.00 ± 38.69 |
|
b |
3.67 ± 0.23 |
-3.09 ± 0.17 |
-3.82 ± 0.22 |
-3.17 ± 0.19 |
-3.27 ± 0.18 |
-3.30 ± 0.23 |
|
|
k |
0.16 ± 0.01 |
0.16 ± 0.01 |
0.20 ± 0.01 |
0.15 ± 0.01 |
0.16 ± 0.01 |
0.15 ± 0.01 |
|
|
Logistic |
a |
1497.30 ± 25.39 |
775.80 ± 68.41 |
893.20 ± 82.65 |
1253.30 ± 24.63 |
812.70 ± 73.98 |
843.10 ± 83.86 |
|
b |
-14.31 ± 1.70 |
-4.65 ± 7.26 |
1.19 ± 7.01 |
-10.80 ± 1.25 |
-3.54 ± 2.04 |
5.78 ± 4.60 |
|
|
k |
0.26 ± 0.01 |
44.08 ± 0.00 |
15.18 ± 5.98 |
0.24 ± 0.01 |
19.17 ± 5.77 |
16.09 ± 79.66 |
|
|
Richards |
a |
1497.30 ± 25.39 |
1166.70 ± 21.77 |
1275.10 ± 12.35 |
1253.30 ± 24.63 |
1183.40 ± 19.09 |
1289.00 ± 27.71 |
|
b |
14.31 ± 1.70 |
10.04 ± 1.18 |
14.50 ± 1.40 |
10.80 ± 1.25 |
11.12 ± 1.40 |
11.71 ± 1.61 |
|
|
k |
0.13 ± 0.01 |
0.12 ± 0.01 |
0.15 ± 0.01 |
0.12 ± 0.01 |
0.15 ± 0.01 |
0.12 ± 0.00 |
|
|
m |
0.50 ± 0.00 |
0.50 ± 0.00 |
0.50 ± 0.00 |
0.50 ± 0.00 |
0.50 ± 0.00 |
0.50 ± 0.00 |
|
|
Bridges |
a |
2427.00 ± 199.30 |
1630.60 ± 66.78 |
1758.80 ± 63.02 |
1868.00 ± 111.50 |
1617.60 ± 55.60 |
1921.60 ± 132.60 |
|
b |
154.60 ± 48.24 |
98.68 ± 29.88 |
189.50 ± 49.29 |
98.87 ± 33.74 |
133.60 ± 35.59 |
114.10 ± 41.74 |
|
|
k |
0.10 ± 0.02 |
0.12 ± 0.01 |
0.16 ± 0.02 |
0.11 ± 0.01 |
0.15 ± 0.01 |
0.11 ± 0.02 |
|
|
m |
0.50 ± 0.00 |
0.50 ± 0.00 |
0.50 ± 0.00 |
0.50 ± 0.00 |
0.50 ± 0.00 |
0.50 ± 0.00 |
|
|
Janoschek |
a |
2272.40 ± 229.00 |
1532.00 ± 82.41 |
1569.30 ± 80.31 |
1769.10 ± 131.40 |
1484.00 ± 70.90 |
1807.00 ± 156.30 |
|
b |
154.60 ± 48.24 |
98.68 ± 29.88 |
189.50 ± 49.29 |
98.87 ± 33.74 |
133.60 ± 35.59 |
114.10 ± 41.74 |
|
|
k |
0.10 ± 0.02 |
0.12 ± 0.01 |
0.16 ± 0.02 |
0.11 ± 0.01 |
0.15 ± 0.02 |
0.11 ± 0.02 |
|
|
m |
0.50 ± 0.00 |
0.50 ± 0.00 |
0.50 ± 0.00 |
0.50 ± 0.00 |
0.50 ± 0.00 |
0.05 ± 0.00 |
|
|
Note: a=asymptotic growth, b=constant of integration, k=rate of maturity and m=inflection point SE=Standard Error. |
|||||||
Table 3: The estimated growth parameters (mean ± SE) for the selected Fulani ecotype chickens using the six growth functions.
Citation: Ogunshola OJ, Morenikeji OB, Chineke CA (2020) Modeling the Growth Curves of Selected Fulani Ecotype Chickens. Modeling the Growth Curves of Selected Fulani Ecotype Chickens. Open Acc J Agri Res: OAJAR-100028.