
Open Access Journal of Agriculture Research
(ISSN 2651-9003)
Research Article
An Economic Analysis on Production and Marketing of Rapeseed in Kailali, Nepal
Sujan P1*, Sabuj A1, Suraj KC1, Kabita P1, Kushal G1 and Prasad SC2
1Department of Agriculture and Forestry University, Rampur Nepal, India
2Department of Soil science and Agri Engineering, Rampur Nepal, India
*Corresponding author: Pokharel Sujan, Student at Agriculture and Forestry University, Rampur Nepal, India, Tel +977-9849917755; Email: pokharel2014sujan@gmail.com
Citation: Sujan P, Sabuj A, Suraj KC, Kabita P, Kushal G, Prasad SC (2020) An Economic Analysis On Production and Marketing of Rapeseed in Kailali, Nepal. Open Acc J Agri Res: OAJAR-100023
Received date: 22 November 2019; Accepted date: 29 December, 2019; Published date: 06 January, 2020
Abstract
A study was conducted in 2019 to analyze the economics of production and marketing of rapeseed in Kailali district of Nepal. This study used 127 rapeseed farmers which were selected by simple random sampling technique to study the production aspects and to study marketing aspects, 5 local traders, 5 wholesaler/commission agents and 3 processors were surveyed. Descriptive statistics, chi-square test and independent sample t-test were used for data analysis using SPSS and MS-Excel. Farmers were categorized into large farmer (n=45) and small farmer (n=82) based on rapeseed farm size category. The average area under rapeseed production was 0.53 ha (15.98 kattha). Rapeseed was found to be a profitable enterprise which has the benefit-cost ratio of 1.55. Benefit-cost ratio of large farms (1.74) was found to higher as compared to small farms (1.46). It was found that rapeseed sub sector contributes about 9.2 percent of household income in the study area. Human labor (40.08% of total variable cost) was an important and largely used input in the production of rapeseed. On an average, marketed surplus was found to be 55.2 percent of total produce. The marketed surplus was higher in case of large farms (58.4%) as compared to small farms (46.8%). It was found that Channel II (Producer-Local Collector-Wholesaler/commission Agent-Processor) was the most adopted marketing channel for rapeseed marketing. The marketing cost (NRs 340/quintal) and market margin (NRs 450/quintal) was found to be higher in case of Channel II (Producer-Local Collector-Wholesaler/commission Agent-Processor). Unavailability of inputs, lack of irrigation facilities, low price of output and incidence of disease and pests were the major problems of rapeseed production and marketing.
Keywords: Benefit-Cost Ratio; Channel; Marketing; Production; Rapeseed
Introduction
Rapeseed (Brassica campestris L. Var. toria) is one of the important oilseed crops of Nepal which belongs to family Cruciferae and is popularly known as tori in Nepal. Rapeseed is the major oilseed crop over other in terms of area, production and productivity. The total area under rapeseed production is 160, 352 ha and total production is 159, 710 mt. with productivity of 0.996 mt/ha. Its seed contain 45% oil and 30% protein [1]. Similarly, 4.8% nitrogen, 2% phosphorus and 1.3% potash can be obtained from rapeseed oil cake. Rapeseed is normally cultivated as a rabi crop in Nepal as it requires relatively cooler temperatures for seed setting and oil formation. Sowing normally starts from October to November and the crop season spreads up to the month of February [2].
Rapeseed is gaining wide acceptance among the farmers because of adaptability for both irrigated as well as rain fed areas and suitability for sole as well as mixed cropping. Besides, it offers higher return with low cost of production and low water requirement. The major oilseed growing districts of Nepal are Kailali, Chitwan, Dang, Bardiya, Banke, Morang, Khotang and Sunsari. Kailali is one of the potential districts for oilseed production being grown in 20,000 ha area. The average production of oilseeds is 21600 mt. (PMAMP O. Z., 2074). Kailali is the leading oilseed producing district of Nepal followed [3].
The noteworthy situation in Kailali is that there has been wide fluctuation in rapeseed production, which is attributed to a number of factors such as seasonal conditions, labor shortage and high cost of labor, difficult access to credit and technology, problem of irrigation, inadequate and untimely supply of seeds and fertilizers, incidence of disease-pests and inefficient marketing and pricing system. Most of the farmers have been following less profitable, traditional production practices which are characterized by high cost of production, low productivity and consequent lesser profitability. The climatic condition of lower terai of Kailali district is best suitable for oilseed cultivation. This region has huge potential for oilseed production and oilseed based agribusiness enterprise establishment. However, the comparative advantage of rapeseed for this region is not yet seriously explored and exploited. A coordinated study is required for suggesting measures to be taken for expansion of area under rapeseed cultivation and maximizing rapeseed production and profitability of farmers.
Keeping this on view, this study was conducted to access the economics of rapeseed production and marketing in Kailali district with the following specific objectives:
Materials and Methods
Study area and sampling design: The study was conducted in Kailali district of Nepal. Kailali, a terai district of far western development region exhibit the immense potentialities of oilseed production. Ghodhagodhi Municipality, Bhajani Municipality, Joshipur Rural Municipality and Janaki Rural Municipality were purposively selected for the study because they are major rapeseed producing areas of this district. There were 1270 households producing rapeseed in the study area [4]. Thus, all the households of the study area were taken as sampling frame. Among them, 127 households were selected randomly for the purpose of this study. The collected data was coded and entered in Statistical Package for Social Science (SPSS) and analyzed using SPSS and MS-Excel. On the basis of average rapeseed farm size, the farmers were categorized into large holder (>15.98 kattha) and small holder farmer (<15.98 kattha) which was adapted from Sapokta (2016). The further analysis is done by comparing between these two categories of farmers.
Total variable cost = Clabor+Ctractor + Cseed + Cferti + Cpesti + Cmanure + Cthresher + Cirri
Where,
Clabor = Cost on human labor used (NRs/ha), Ctractor = Cost on tractor labor used (NRs/ha), Cseed = Cost on seed (NRs/ha), Cferti = Cost on inorganic chemical fertilizer (NRs/ha), Cirri = Cost on irrigation (NRs/ha), Cpesti = Cost on pesticides (NRs/ha), Cmanure = Cost on organic manures (NRs/ha), Cthresher = Cost on threshing (NRs/ha).
Gross return was calculated by multiplying the total volume of output from rapeseed by the average price at harvesting period. Gross margin was calculated by using the method as given by Olukosi, Isitor, & Ode (2006) using followig formula;
Gross Margin (NRs/ha) = Gross return (NRs/ha) – Total variable cost (NRs/ha)
Undiscounted benefit cost ratio was estimated as a ratio of gross return and total variable cost.
Benefit cost ratio (BCR) = Gross Return (NRs/ha) / Total variable cost (NRs/ha)
Farmer’s perception to the different production and marketing problems were ranked by using importance of scale technique (six point scales).
Results and Discussion
Area, production and productivity of rapeseed cultivation: The average area under rapeseed cultivation was estimated to be 0.53 ha (15.98 kattha) [5]. The average area under rapeseed cultivation of large holder farmers (27.04 kattha) was found significantly higher than small holder farmers (9.91 kattha) at 1 percent level of significance: The overall average productivity of rapeseed in the study area was calculated to be 33.36 kg/kattha. No any statistical significance was found between large holder farmers (32.89 kg/kattha) and small holder farmers (33.62 kg/kattha) in terms of productivity however productivity of small farms was found to be more than that of large farms. Similarly, the overall average production of rapeseed in the study was estimated to be 5.18 quintal. The quantity of rapeseed produced by large holder farmers (8.74 quintal) was found to be significantly higher than that of small holder farmers (3.23 quintal) at 1 percent level of significance (Table 1).
Cost of production: Human labor was an important and largely used input in the production of rapeseed. The cost of human labor in rapeseed production per hectare was estimated to be about NRs.15090. Labor cost accounted about 40.08 percent of total variable cost in rapeseed production. It has shown that rapeseed production activity in the study area is labor intensive. Similar to this, [6-8] reported that labor cost accounted about 33 percent of total variable cost in mustard production in Chitwan district: In the study area, all the farmers used tractor or power tiller as a tillage equipment for their land preparation. Per hectare costs of tractor was about NRs. 8610, which accounted about 22.85 percent of total variable cost of rapeseed production. Per hectare cost of organic manure was about NRs. 1920 which constituted about 5.09 percent of total variable cost. Almost all farmers used chemical fertilizers, mainly urea and DAP. Per hectare cost of Urea was estimated at about NRS 1560 which accounted about 4.14% of total variable costs while that of DAP constituted about 12.89 percent of total variable costs. MOP was used by very few farmers which constituted about only 1.19 percent of total variable cost. Per hectare cost of operating thresher was estimated about NRs 2700 which constituted about 7.16 percent of total variable cost (Table 2).
Cost and return analysis: The total cost of rapeseed production in one hectare of land was estimated to be NRs.37680 while the total gross revenue from rapeseed production was estimated to be NRs.58680. The average profit from one hectare of land from rapeseed production was found to be NRs. 21000 having B/C ratio of 1.55. B/C ratio of large farms (1.74) was found higher than that of small farms (1.46) (Table 3). Sonvanee & Pathak (2016) also found the average B/C ratio of 1.35 on rapeseed production in Chhattisgarh of India.
Utilization of rapeseed: It has been found that selected farmers retained rapeseed and mustard crop for home consumption and for seed. The Table 4 shows that the average rapeseed produce used by farmers was estimated to be 44.8 percent of total produce. Small holder farmers (53.2%) have retained larger amount of rapeseed for home consumption than that of large holder farmers (41.6%). On an average, marketed surplus was found to be 55.2 percent of total produce. The marketed surplus was higher in case of large farms (58.4%) as compared to small farms (46.8%) because large farms retained less quantity of produce for home consumption and seed use.
Figures in parentheses are percentages to their respective totals.
Different sources of household income: It was found that rapeseed sub sector contributes about 9.2 percent of household income in the study area. Rapeseed sub-sector contribution on total household income of large holder farmers and small holder farmers was found to be 10.1 percent and 8.2 percent respectively. On an average, income from cereals, live stocks, vegetables and fruits and off farm income have contributed about 44.2 percent, 4.6 percent, 1.2 percent and 40.8 percent respectively (Table 5).
Varieties of rapeseed: It was found that majority of farmers (68%) have grown local variety of rapeseed. Similarly, 23 percent, 2 percent, 1 percent and 6 percent of farmers have grown Morang-2, Pragati, Surkhet Local and Unnati variety of rapeseed respectively (Figure 1).
Marketing channel: Marketing of a commodity is an important part of every production process. Marketing channel refers to the path through which a commodity moves from producer to ultimate consumer. It is desired that the movement of the goods from producer to consumer should be at the minimum cost consistent with provision of services. The marketing of rapeseed from producer to consumer involved a number of intermediaries in the study area. Three marketing channels were identified in the study area through which the commodity passed from producer to ultimate consumer i.e processors.
Channel I: Producer-Consumer cum processor.
Channel II: Producer-Local Collector-Wholesaler/commission Agent-Processor.
Channel III: Producer-Wholesaler/commission Agent-Processor.
Marketing costs
Cost incurred on rapeseed marketing in Channel I: Producer- Consumer cum processor: The marketing costs incurred by producer farmers in this channel are presented in Table 7. In this channel the total marketing cost was estimated to be NRs. 58 per quintal when producer sold their rapeseed through channel I (Producer-Consumer cum Processor).
Cost incurred on rapeseed marketing in Channel II: Producer-Local collector-Wholesaler/commission agent-Processor: This was the most common method of selling rapeseed in the study area. The marketing costs incurred by the farmers and middlemen in this channel are presented in Table 8. In this channel, total marketing cost was estimated at the rate of NRs. 340 per quintal when producer farmers sold their rapeseed through channel II (Producer-Local collector-Wholesaler/commission agent-Processor). In this channel, NRs.40 (11.7%), NRs. 100(29.4%) and NRs. 200(58.9%) were incurred by producers, local collectors and wholesaler/commission agents, respectively in the study area. Bags, transportation, storage costs were main items of cost for marketing of rapeseed.
Figures in parentheses are the percentages by their respective columns totals. Figures in big brackets are the percentage by the total marketing costs. *other costs include cost of loading, unloading, cleaning etc.
Cost incurred on rapeseed marketing in Channel III: Producer-Wholesaler/commission agent-Processor: In this channel, total marketing cost was estimated at the rate of NRs. 240 per quintal when producers sold their rapeseed through Channel III (Producer-Wholesaler/commission agent-Processor). In this channel, NRs 40 (16.7%) and NRs. 200 (83.3%) were incurred by producers and wholesaler/commission agents, respectively in the study area (Table 9).
Figures in parentheses are the percentages by their respective columns totals. Figures in big brackets are the percentage by the total marketing costs. *other costs include cost of loading, unloading, cleaning etc.
Market margin and Price spread
Price spread in marketing of rapeseed in Channel I: Producer- Consumer cum Processor the price spread in the marketing of rapeseed in Channel I was presented in the Table 10. Producer’s net share in consumer’s rupee was found to be NRs. 6342 per quintal (99.10 %). Marketing costs incurred during the marketing of rapeseed by this channel is NRs. 58 per quintal (0.90%).
Price spread in marketing of rapeseed in Channel II: Producer-Local collector-Wholesaler/commission agent-Processor: Price spread in the marketing of rapeseed through channel II is presented in the Table 11. Producer’s net share in the consumer’s rupee was found to be NRs. 6060 per quintal (88.48 %). The total cost incurred by producer farmer, local trader and wholesaler/commission agents was NRs 340 per quintal (4.96 percent). Margin earned by local trader and wholesaler/commission agents was found to be NRs 150 per quintal (2.19 %) and NRs. 300 per quintal (4.37%) respectively. On an average total costs and margins was found to be NRs. 790 per quintal (11.52%). Producer sold their produce to local trader at NRs. 6100 per quintal and local trader sold it to wholesaler at NRs. 6350 per quintal. And finally wholesaler disposes the rapeseed to processors at NRs. 6850 per quintal.
Price spread in marketing of rapeseed in Channel III: Producer- wholesaler/commission agent-Processor: Price spread in marketing of rapeseed through channel III is presented in table 12. Producer’s net share in this channel was found to be NRs. 6310 per quintal (92.13%). Total marketing costs incurred by producer and wholesaler/commission agents was found to be NRs. 240 per quintal (3.50 %). Similarly, total market margin earned by wholesaler/commission agent was found to be NRs. 300 per quintal (4.37%). On an average total marketing cost and market margin was estimated to be NRs. 540 per quintal (7.87%). Producer disposes their product to wholesaler at NRs. 6350 per quintal and finally wholesaler sold it to processors at NRs. 6850 per quintal.
It was found that with the increase on length of marketing channel i.e. increment on number of intermediaries, both the marketing cost and market margin goes on increasing. Similar to this, Gupta and Singh (1998) in their study entitled “Price spread in marketing of groundnut and rapeseed mustard in Punjab” for the year 1995-96 revealed that as the number of functionary’s increase, they add value of commodity in the marketing channels resulting fall in producer’s share in the consumer rupee [9].
Problems in production and marketing of rapeseed
Problem ranking was done by the importance of scale technique. The overall scenario of problems faced by the cultivators in rapeseed production and marketing revealed that unavailability of inputs, labor shortage, lack of irrigation facilities, poor market access, low price of outputs and damage by insects and pests. It was found that unavailability of inputs like seed, fertilizers etc. was the top ranked problem of the study area. Low price of produce was ranked as the second problem. Insect pest damage was ranked as the third problem. Similarly, lack of irrigation facility was the fourth ranked problem. Poor market access and labor shortage was the fifth and sixth ranked problem on the study area. Table 13 shows the ranking of production and marketing problems by farm size category.
Conclusion
The climatic suitability of Kailali district favors the ample potentiality for rapeseed production. The average productivity of rapeseed in the studied area was found to be 1008.8 kg/ha which was found to be less than that of district average (1168kg/ha) and greater than that of national average (996 kg/ha).The average benefit-cost ratio of rapeseed in the study area was calculated to be 1.55. However, most of the farmers were still practicing traditional way of cultivation. They were using their own local seed for rapeseed production which have low productivity as compared to other released varieties. Rapeseed growers of the studied area haven’t used sulfur and other micronutrients as well as potash fertilizers which have great and direct influence on the rapeseed production. Similarly, the rapeseed growers of the studied area haven’t followed the recommended practices of cultivation. It was found that channel II was the most adopted marketing channel. The marketing cost goes on increasing with the increase in the length of the marketing channel. The major problems of production and marketing were found to be unavailability of inputs, lack of irrigation facilities and low price of outputs. Human labor was found to be the major component of total variable cost.
Acknowledgement
I would like to express my deepest acknowledgement, profound gratitude and indebtedness to all the concerned people, Prime Minister Agriculture Modernization Project (PMAMP), Agriculture and Forestry University (AFU) and to major supervisor Mr. Chandeshwar Prasad Shriwastav, Professor of Soil science and Agricultural Engineering, Agriculture and Forestry University (AFU) for their significant contribution and support during my study. With the most appreciation, I am grateful to all the respondents of the study area, who provided the information without any hesitation, warm love, and great hospitality during my field visit.
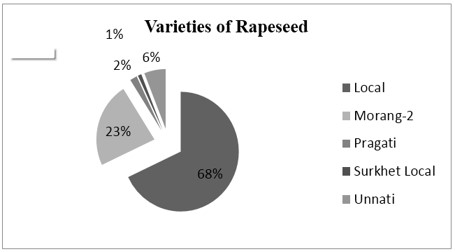
Figure 1: Pie chart showing varieties of rapeseed grown in study area.
|
Variables |
Overall (N=127) |
Small holder farmers(n=82) |
Large holder farmers(n=45) |
Mean difference |
t-value |
|
Total area under rapeseed cultivation(kattha) |
15.98 |
9.91 |
27.04 |
-17.129*** |
-13.006 |
|
Production(quintal) |
5.18 |
3.23 |
8.74 |
-5.503*** |
-10.404 |
|
Productivity(kg/kattha) |
33.36 |
33.62 |
32.89 |
0.729 |
0.331 |
Table 1: Area, production and productivity of rapeseed by farm size category.
|
Particulars |
Amount(NRs/ha) |
Share to total cost (%) |
|
Seed |
1200 |
3.18 |
|
Farm Yard Manure(FYM) |
1920 |
5.09 |
|
Urea |
1560 |
4.14 |
|
DAP |
4860 |
12.89 |
|
MOP |
450 |
1.19 |
|
Irrigation cost |
660 |
1.75 |
|
Plant protection |
630 |
1.67 |
|
Tractor/power tiller |
8610 |
22.85 |
|
Thresher |
2700 |
7.16 |
|
Human labor |
15090 |
40.08 |
|
Total cost |
37,680 |
100 |
Table 2: Cost of production of rapeseed in one hectare of land.
|
Particulars |
Overall (N=127) |
Small holder farmers(n=82) |
Large holder farmers(n=45) |
|
Total cost(NRs/ha) |
37680 |
39330 |
34710 |
|
Gross return(NRs/ha) |
58680 |
57690 |
60510 |
|
Profit(NRS/ha) |
21000 |
18360 |
25800 |
|
B/C ratio |
1.55 |
1.46 |
1.74 |
Table 3: Cost and return analysis.
|
Particulars |
Small holder farmer(n=82) |
Large holder farmer(n=45) |
Overall (N=127) |
|
Total Production |
3.23(100.0) |
8.74(100.0) |
5.98(100.0) |
|
Utilization |
1.72(53.2) |
3.64(41.6) |
2.68(44.8) |
|
Marketed surplus |
1.51(46.8) |
5.11(58.4) |
3.31(55.2) |
Table 4: Utilization of rapeseed.
|
Particulars |
Overall (N=127) |
Small holder farmers(n=82) |
Large holder farmers(n=45) |
|
Income from rapeseed(NRs/HH) |
31443.0(9.2) |
19043(8.2) |
54040(10.1) |
|
Income from cereals(NRs/HH) |
150013(44.2) |
97412(41.8) |
245866(46.4) |
|
Income from live stocks(NRs/HH) |
15977(4.6) |
15646(6.7) |
16560(2.5) |
|
Income from vegetables and fruits(NRs/HH) |
4196(1.2) |
5951(2.5) |
1000(0.2) |
|
Off-farm income(NRs/HH) |
139309(40.8) |
94733(40.8) |
217318(40.8) |
|
Total Income |
340938(100.0) |
232785(100.0) |
534784(100.0) |
Table 5: Distribution of household income from various sources based on farm size category. Parentheses include the percentage share to total.
|
Marketing Channel |
Small holder farmers(n=82) |
Large holder farmers(n=45) |
Overall(N=127) |
Chi-square value |
|
Channel I |
17(20.7) |
9(20.0) |
26(20.5) |
2.329 |
|
Channel II |
41(50.0) |
28(62.2) |
69(54.3) |
- |
|
Channel III |
24(29.3) |
8(17.8) |
32(25.2) |
- |
Table 6: Marketing channel adopted based on farm size category. Figures in parentheses are the percentages by their respective columns totals.
|
Costs(NRs/quintal) |
Producer |
|
Bags |
30(51.7) |
|
Transportation |
28(48.3) |
|
Total |
58(100.0) |
Table 7: Marketing costs incurred on rapeseed in Channel I: Producer-Consumer cum Processor, figures in parentheses are the percentages by their respective columns totals.
|
Costs (NRs/quintal) |
Producer |
Local collector |
Wholesaler/commission agents |
Total |
|
Bags |
30(75.0) |
- |
- |
30(8.8) |
|
Transportation |
10(25.0) |
50(50.0) |
- |
60(17.6) |
|
Storage and other costs* |
- |
50(50.0) |
200(100.0) |
250(73.6) |
|
Total |
40(100.0) |
100(100.0) |
200(100.0) |
340(100.0) |
|
[11.7] |
[29.4] |
[58.9] |
[100.0] |
Table 8: Marketing costs incurred on rapeseed in Channel II: Producer-Local Collector-Wholesaler/commission Agent-Processor.
|
Costs (NRs/quintal) |
Producer |
Wholesaler/commission agent |
Total |
|
Bags |
30(75.0) |
- |
30(12.5) |
|
Transportation |
10(25.0) |
- |
10(4.2) |
|
Storage and other costs* |
- |
200(100.0) |
200(83.3) |
|
Total |
40(100.0) |
200(100.0) |
240(100.0) |
|
[16.7] |
[83.3] |
[100.0] |
Table 9: Marketing costs incurred on rapeseed in Channel III: Producer-Wholesaler/commission Agent-Processor.
|
S.N |
Particulars |
NRs/Quintal |
Share in consumer’s rupee (in percent) |
|
1 |
Producers net share |
6342 |
99.1 |
|
2 |
Total marketing cost incurred by producer farmer |
58 |
0.9 |
|
3 |
Producer’s selling price or Consumer’s price (or processor’s purchase price) |
6400 |
100 |
Table 10: Price spread in marketing of rapeseed in Channel I: Producer- Consumer cum Processor.
|
S.N |
Particulars |
NRs/quintal |
Share in consumer’s rupee (in percent) |
|
1 |
Producer’s net share |
6060 |
88.48 |
|
2 |
Costs incurred by |
- |
- |
|
a. Producer farmer |
40 |
0.58 |
|
|
b. Local trader |
100 |
1.46 |
|
|
c. Wholesaler/ Commission agent |
200 |
2.92 |
|
|
|
Total costs |
340 |
4.96 |
|
3 |
Margin earned by |
- |
- |
|
a. Local trader |
150 |
2.19 |
|
|
b. Wholesaler/commission agent |
300 |
4.37 |
|
|
Total margin |
450 |
6.56 |
|
|
4 |
Total cost and margin |
790 |
11.52 |
|
5 |
Producer’s selling price (consumer’s price) |
6850 |
100 |
Table 11: Price spread in marketing of rapeseed in Channel II: Producer-Local Collector-Wholesaler/commission agent-Processor.
|
S.N |
Particulars |
NRs/quintal |
Share in consumer’s rupee (in percent) |
|
1 |
Producer’s net share |
6310 |
92.13 |
|
2 |
Costs incurred by |
- |
- |
|
a. Producer farmer |
40 |
0.58 |
|
|
b. Wholesaler/ Commission agent |
200 |
2.92 |
|
|
Total costs |
240 |
3.5 |
|
|
3 |
Margin earned by |
- |
- |
|
a. Wholesaler/commission agent |
300 |
4.37 |
|
|
Total margins |
300 |
4.37 |
|
|
4 |
Total cost and margin |
540 |
7.87 |
|
5 |
Producer’s selling price (consumer’s price) |
6850 |
100 |
Table 12: Price spread in marketing of rapeseed in Channel III: Producer- Wholesaler/commission agent-Processor.
|
Production and marketing problems |
Small holder farmer (n=82) |
Large holder farmer (n=45) |
Overall (N=127) |
|||
|
Index |
Rank |
Index |
Rank |
Index |
Rank |
|
|
Unavailability of inputs |
0.761 |
II |
0.845 |
I |
0.791 |
I |
|
Labor shortage |
0.392 |
V |
0.374 |
VI |
0.378 |
VI |
|
Lack of irrigation facilities |
0.579 |
IV |
0.567 |
III |
0.575 |
IV |
|
Poor market access |
0.378 |
VI |
0.427 |
V |
0.403 |
V |
|
Low price of outputs |
0.789 |
I |
0.752 |
II |
0.776 |
II |
|
Insect pest damage |
0.602 |
III |
0.538 |
IV |
0.579 |
III |
Table 13: Production and marketing problem ranking by farm size category.
Citation: Sujan P, Sabuj A, Suraj KC, Kabita P, Kushal G, Prasad SC (2020) An Economic Analysis On Production and Marketing of Rapeseed in Kailali, Nepal. Open Acc J Agri Res: OAJAR-100023