
International Journal of Education Advancement
Research Article
Determinant Factors Influencing Absenteeism among Ethiopian Health Science College Students
Leta M1*, Haymanot GT2 and Yewendwosen E2
1Department of Midwifery, Harar Health Science College, Harar, Ethiopia
2Department of Health Extensio, Harar Health Science College, Harar, Ethiopia
*Corresponding author: Masresha Leta, Department of Midwifery, Harar Health Science College, Harar, Ethiopia.
Citation: Leta M, Haymanot GT, Yewendwosen E (2020) Determinant Factors Influencing Absenteeism among Ethiopian Health Science College Students. Int J Educ Adv: IJEA-100003.
Received date: 05 December 2019; Accepted date: 16 December 2019; Published date: 23 January 2020
Abstract
Introduction: The absenteeism of students from classrooms and clinical setting has a negative impact on their performance and prolongs the length of their studying. The aim of this study was to identify the factors influencing absenteeism among students at Harar Health Science College.
Methods: Institution based cross-sectional study was conducted on 313 college health science students. A self-administered pre tested questionnaire which consists of teaching (6 items), course content (4 items), learning (4 items), assessment (6 items) and social problems (3 items) was used to collect data by using Stratified random sampling method with proportionate allocation.
Results: 38 (31.1%) was taken the highest frequency of 4 or more days’ absenteeism and Pharmacy department was the leading from all other health science departments. The main reasons reported for missing lectures, clinical site and skill lab were shortage of instructors at clinical site, insufficient equipment at demonstration room, inconvenient language used by the instructors and the assessment technique used by the instructors.
Conclusion: The overall prevalence of absenteeism from the class room as well as hospital practice was 186 (59.4%) and 115 (36.7%) respectively.
Keywords: Ethiopian Health; Education; Health science
Abbreviations
BSC : Bachelor of Science
HHSC : Harar Health Science College
Introduction
Absenteeism refers to the act of routinely avoiding work or school without justifiable reason. It might be characterized as not coming to class or not following the courses without having a legal reason [1]. Absenteeism is rises because of lack of the appropriate assets, deficiency of educational staff, and tools in theoretical areas exercise in hospitals, inadequate numbers of labs and shortage of client to learners. Learner may also absent due to some reasons like sickness, immediate death in the family, court directive, spiritual observation, and school official work or action, hazardous climate surroundings, public disaster, nonexistence of official conveyance, and interruption [2]. In the Health profession, student attendance during training is mandatory since it forms an integral part of their training. During their training, students attend classes for theoretical instructions and are occasionally placed in different clinical areas according to their level of training, for practical exposure, in order to correlate theory and practice. In order to meet the requirements of training, they are expected to attend a certain percentage of hours of both theory and practical training [3]. Absenteeism from clinical areas and lectures among health science students is a significant problem that if not addressed will adversely affect the quality of patient care. Ill-health, nursing a baby, participation in other roles besides academic activities, transportation difficulties, preparing for another examination, inconvenient class schedule, lack of interest in the subject matter, dislike of teaching style and the ease of understanding the subject matter without guidance are important contributions to absenteeism, despite the health curriculum requirement of 100% class and practical area attendance unless the student has legitimate reasons for missing class [4]. Therefore, this study was conducted to assess factors influencing absenteeism among Students at Harar Health Science College. It will be beneficial for the students who will habitual absent maker or late comers to assure them how the absenteeism badly affects their performance and future carrier .so that they became agree to improve their attendance and reduce absent rate hence they can able to get good grades and improve learning abilities and their performance in study by attending the lectures and clinical area regularly.
Materials and Methods
Study Setting: The study was conducted in Harar town, eastern Ethiopia, which is located 525 kilometers east of Addis Ababa. Harar Health Science College is a public higher educational institution offering a range of health science higher training and educations of various levels for a period of almost half a century contributing to the development of the country by producing competent health workforce and professionals.
Study Design and Data Collection: A descriptive cross-sectional study design was used to identify the factors that contributed to the absenteeism of students at Harar Health Science College. The sample size was calculated using the single population proportion formula. Assuming the prevalence of student one or more class absenteeism was found to be 75 % [5]. Since the source population was less than 10,000, finite population correction was made, which brought the sample size to 313. Harar Health Science college students who were registered from 2nd to 5th year and attend their classes during the study period were included in the study. Stratified random sampling method with proportional allocation was used to get the required sample size. Strata was created based on program, study year and sample within each stratum was selected by simple random sampling technique. A self-administered questionnaire included questions on demographic variables, questions relevant to the reasons contributing to absence of health science students.
Data Analysis: Following data collection, a unique code was assigned to each questionnaire. Collected data was edited, coded, categorized and entered into Epi-Data version 3.1 and exported to SPSS version 21 windows statistical software for analysis. Frequency tables, graphs and as mean, standard deviation was used.
Consideration: The study was carried out after obtaining ethical clearance from Institutional Ethical Clearance Board of Harar Health Science College, Ethical Clearance Review committee. Permission was obtaining from study institution. All the participants were informed the purpose, advantages and disadvantages, there have the right to be involved or not. Informed consent was obtained from all participants as code numbers were used and only data collector and supervisor were involved in the data collection and supervision process.
Results
Socio-Demographic Result: From 317 eligible full-time undergraduate students, 313 consented and completed the questionnaire which makes response rate 98.7%. Ages of the respondent range from 16 to 29 years with mean age of 20.2 years, with the standard deviation of (SD ± 2.51). Majority 163 (52.1%) of the respondent were Male and single 239 (76.4%) on their marital status.
Of the total respondent 41.5 % were Muslims. Majority of student’s mother and father education were primary and secondary level. The mean (± SD) of the average monthly income of the clients was 1206.13 ± 1015.23 ranging from 100 to 8000 ETB. One third of the respondent ethnic groups (38.3%) were Oromo followed by Amhara (33.2%). More than half 259 (82.7%) of the respondent were urban habitant (Table 1).
Participant of different academic level and department are involved in this study. (Figure 1) Majority 284 (90.7%) of the respondent were choose the field of study by their own interest. More than half 294 (93.9 %) of the respondent were also like their field of study.
Interest of students to join the fields: Most of the students both in diploma and degree program join the fields with their interests and majority of the respondents (33.5%) were from third year students (Table 2).
Proportion of student absenteeism: In this study majority of student were absent from class room as well as hospital practice due to several reasons. More than half 186 (59.4%) of student were absent one or more times from the class room and 115 (36.7%) of student were absent from hospital practice (Table 3).
Base line Characteristics of students on absenteeism: Number of student absenteeism days was classified on three categories. Those are never missed class, 1 up to 3 days absent and 4 or more day absent. Analysis finding showed that majority 63 (51.6%) of student were absent 4 or more days and never missed 58 (45.7%) the class also observed in Age group 15-19.
While we compare sex of the respondent Female students 98 (52.7%) was more likely absent than Male 88 (47.3%). Students whose residence in urban 150 (80.6%) was more likely to be absent than Rural 36 (19.4%) habitant. Regarding departments 10 departments was included in the study among this the highest frequency being absent on 4 and more than four days observed in Pharmacy department 38 (31.1%) followed by Comprehensive Nurse 33(27%) and Midwifery 21 (17.2%). While the least number of student who never missed their class was found on Pediatrics 4 (3.1%) followed by Anesthesia 5 (3.9%) and Emergency Nursing 6 (4.7 %).Regarding field of study even students were joined the field as per them choose majority 108 (88.5%) of the student was absent from their study on 4 or more days than students who joined the field with out 8 (6.6%) them choose. Our result finding showed that students become absent 4 or more days on their 1st year 34 (27.9%) and 3rd year 42 (34.4%) class than 2nd year 32 (26.2%) and 4th 8(6.6%) and above year.
Baseline characteristics of students: Majority of the respondent (51.6%) who were missing 4 and above days were with the age group of 15-19 years and most of them were males and urban residents (Table 4).
Assessment result on teaching factor affects absenteeism: The respondent answer related to teaching factor showed that majority 105(33.5%) of the respondent was strongly disagree and 70 (22.4) disagree that there is no sufficient equipments in demonstration room while 104 (33.2%) was agreed.
Majority 99 (31.6%) of respondent was disagree that “they feel certain subjects are forced against their will” while 56 (17.9 %) participant was agreed. 105 (33.5%) participant was Agree that if their lecturer asks him many questions every day.
Changes in program without accounting students concern is another factor that predispose students for absenteeism which was strongly agreed by 123 (39.3%) of the study participants.
Shortage of the staff in the clinical area is another major factor for absenteeism which was agreed by 150 (47.9%) students.
Regarding language used by the teacher 85 (27.2%) participant was agreeing that they understand the language used by the lecturer but 66 (21.1%) was disagreed. 131 (41.9%) participant was agreed that some subject is boring that makes them absent from the class but 30.4% were not (Table 5).
Assessment result on content factor affects absenteeism: Content factor assessment result showed that 92 (29.4 %) was disagree that they are not explained the importance of attending full hours as training requirements but 58 (18.5%) was agreed.
Majority 123 (39.3%) was agreed that the course outlines are not clear to them. Eighty-two (26.2%) was strongly disagreed that they could have a work overloading in the clinical area but 49 (15.7%) was agreed. Most of student 88 (28.1%) was agreed that they do not want to be treated as workforce (Table 6).
Assessment result on Learning Environment factor affects absenteeism: Learning environment factor shows that 155 (49.5%) was strongly disagreed that Because of poor discipline from high school is not the reason for being absent while 30 (9.6%) was agreed. 152 (48.6%) of the respondent was disagreed that when they are not lazy to do work. Majority 109 (34.8%) was agreed that they are late during lessons presentation. Another major factor for absenteeism mentioned by student was when lectures are absent strongly agreed by 166 (53%) of students (Table 7).
Student assessment factor affects absenteeism: Half 186 (59.4%) was strongly disagreed that they could not be absent when supposed to demonstrate procedures but 43.7% was agreed. Almost nearly equal number of students were strongly Agree 65 (20.8%) and strongly disagree 64 (20.4%) that they do not want to do presentations. Two third of students 153 (48.9%) were strongly disagreed that they do not have Poor performance in classroom and it could not be reason for absenteeism.
Another major reason for absenteeism mentioned by the respondent was being not ready to write examination which was strongly agreed by 151 (48.2%) of students. Around 101 (32.3%) was agreed that they are supposed to do feedback evaluation but 71(22.7%) was disagreed. Majority 137 (43.8%) of student strongly disagree that there could not be absent if there were not ready for objective Structured Clinical Evaluation (OSCE) day (Table 8).
Proportion of student Absents and its main reason:
Absenteeism from in school teaching and learning: Among 313 study participants 186 (59.4 %) of students were absent from class room and their most commonly mentioned reason for being absent were preparation for examination 68 (21.7%) learning time inconveniency 44 (14.1%) and teaching and learning method 32 (10.2%) (Table 9).
Absenteeism from in Hospital practice (Co-operative training): Among 313 regular student majority of student replied that their major reason to be absent from the hospital practice was no couching teacher in practical site which accounts 81 (25.9%) followed by Practical time are not convenient 11 (3.5 %) (Table 10).
Discussion
In this study nearly half of students 186 (59.4%) reported that they were absent times from the class room. While 115 (36.7%) of student were also absent from hospital practice. The finding also showed that majority 63 (51.6%) of student were absent 4 or more days per semester. This is in line with a study done at Hawassa among Health science students [6]. Female student 98 (52.7%) and urban 150 (80.6%) habitant are more likely absent than male students. This is in line with a study done at Kenya [7]. Students on pharmacy department 38 (31.1%) was taken the highest frequency of 4 or more days’ absenteeism. Student who joined the field of Pharmacy study 108 (88.5%) as per their choice werereported more absenteeism than their encounter. In the contrarya study done at Hawassa the medical students were more likely to miss classes than other health science students. Despite the health curriculum requirement of more than 75% class attendance unless the student has legitimate reasons for missing class. This difference might be due to huge number of students at the department of pharmacy and negligence of the instructors for taking the attendance. In fact, in both contexts, student preference for their departmental choice Pharmacy and medicine were the first and primary choice for most of the students at Harar health science college and Hawassa university respectively [6].
Several reasons or factor predispose students for being absent was mentioned from the class room. Among teaching factor majority was agreed that insufficient equipment’s in demonstration room 104 (33.2%) in fact which was lower than the study done at Egypt the highest percentage (52.5%) of the nursing students agreed that the main reason of absenteeism from skill lab was that the resources for procedures are not available. This may be due to sample size and study setup difference [8].
In our study, changes in program without accounting students concern 123 (39.3%), Shortage of the staff in the clinical area 150 (47.9%), language used by the lecturer66 (21.1%) were mentioned as teaching factors for their absenteeism. This is in line with a study done at Pakistan.
Regarding assessment factor course outlines are not clear to 123 (39.3%), treated as work force in the hospital area 88 (28.1%). This is in contrary with a study finding of Pakistan which revealed that being not considering them as a work force was a major factor for their absenteeism. This difference might be due to attitude of health professionals toward health science students[9]. In our finding, 58 (18.5%) was mentioned that not explaining the importance of attending full hours as training requirements as a major reason for being absenteeism.
From learning environment factor absenteeism of lecturer was the major reason for being absenteeism 166 (53%). This is in line with the study finding of Egypt [8].
From assessment factor students were agreed that there were absent from the class if there are expected to have presentation 77 (24.6%), When there are not ready to write examination 151 (48.2%).
Mainly students reason for being absent from the in school training was examination 68 (21.7%) learning time inconveniency 44 (14.1%) and teaching and learning method 32 (10.2%). While the main reason mentioned for being absent from cooperative training was no couching teacher in practical site which accounts 81 (25.9%) followed by Practical time are not convenient 11 (3.5 %).This is in contrary with the study finding of Pakistan with the main reason for their absenteeism was they work over-burdening in the clinical area. This difference might be due to difference in study set up [9].
Conclusion and Recommendation
The overall prevalence of absenteeism from the class room as well as hospital practice was 186 (59.4%) and 115 (36.7%) respectively. Training based teaching requirements will likely increase attendance.
Acknowledgments
Authors would like to thank participants of the study. We would like to extend our appreciations to individuals who were involved in data collection. We are also grateful to the colleges that facilitated the study.
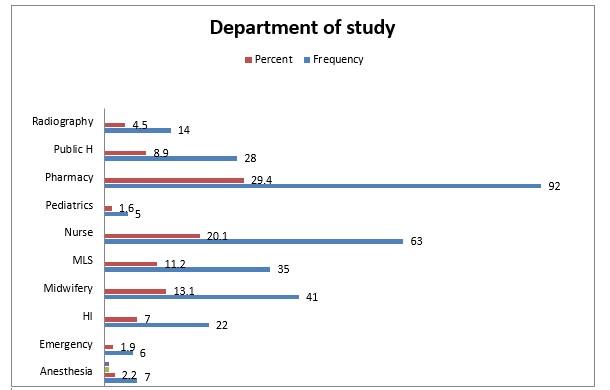
Figure1: Department composition of students attending their studies at Harar Health Science College Harar, Eastern Ethiopia 2019 (n= 313).
|
Variable |
Frequency |
Percent |
|
Age in years |
||
|
15-19 |
148 |
47.3% |
|
20-24 |
142 |
45.4% |
|
25-29 |
23 |
7.3% |
|
Mean ±SD |
- |
20.2 ± 2.51 |
|
Sex |
||
|
Male |
163 |
52.1 |
|
Female |
150 |
47.9 |
|
Marital Status |
||
|
Single |
239 |
76.4 |
|
Married |
66 |
21.1 |
|
Divorce |
8 |
2.6 |
|
Religion |
||
|
Muslim |
130 |
41.5 |
|
Orthodox |
129 |
41.2 |
|
Protestant |
49 |
15.7 |
|
Catholic |
5 |
1.6 |
|
Mothers Educational Status |
||
|
Illiterate |
35 |
27.6 |
|
Write and Read |
43 |
13.7 |
|
Primary |
113 |
36.1 |
|
Secondary |
57 |
18.2 |
|
Diploma |
44 |
14.1 |
|
Degree and above |
21 |
6.7 |
|
Fathers educational Status |
||
|
Illiterate |
34 |
10.9 |
|
Write and Read |
33 |
10.5 |
|
Primary |
66 |
21.1 |
|
Secondary |
76 |
24.3 |
|
Diploma |
39 |
12.5 |
|
Degree and above |
65 |
20.8 |
|
Money obtained per Month |
||
|
100 – 200 |
4 |
1.3 |
|
200 – 300 |
16 |
5.1 |
|
300 – 500 |
76 |
24.3 |
|
More than 500 |
217 |
69.3 |
|
Ethnicity |
||
|
Oromo |
120 |
38.3 |
|
Amhara |
104 |
33.2 |
|
Harare |
59 |
18.8 |
|
Tigrai |
17 |
5.4 |
|
Others |
13 |
4.2 |
|
Residence |
||
|
Urban |
259 |
82.7 |
|
Rural |
54 |
17.3 |
Table 1: Socio-demographic characteristics of students attending their studies at Harar Health Science College Harar, Eastern Ethiopia 2019 (n=313).
|
Variable |
Frequency |
Percent |
|
Level of Study |
||
|
Diploma |
127 |
40.6 |
|
Degree |
168 |
53.7 |
|
TVET-Level 5 |
18 |
5.8 |
|
Joined the field of study as per choice |
||
|
Yes |
284 |
90.7 |
|
No |
29 |
9.3 |
|
Interest on the field of study |
||
|
Yes |
294 |
93.9 |
|
No |
19 |
6.1 |
|
Year of Study |
||
|
First Year |
90 |
28.8 |
|
Second Year |
86 |
27.5 |
|
Third Year |
105 |
33.5 |
|
Fourth Year |
22 |
7 |
|
Fifth Year |
10 |
3.2 |
Table 2: Field choose and interest of students attending their studies at Harar Health Science College Harar, Eastern Ethiopia 2019 (n= 313).
|
Student absent from class room |
||
|
Yes |
186 |
59.4 |
|
No |
127 |
40.6 |
|
Student absent from Hospital Practice |
||
|
Yes |
115 |
36.7 |
|
No |
198 |
63.3 |
Table 3: Proportion of student absenteeism at HHSC, Ethiopia 2019 (n=313).
|
- |
Number of students and absent days |
Total |
|||
|
Never miss class |
1 - 3 days |
4 and above |
|||
|
Age |
15-19 |
58 (45.7%) |
27(42.2%) |
63 (51.6%) |
148(47.3%) |
|
20-24 |
55(43.3%) |
34(53.1%) |
53(43.4%) |
142(45.4%) |
|
|
25-29 |
14 (11%) |
3 (4.7%) |
6 (4.9%) |
23 (7.3%) |
|
|
Sex of Respondent |
Male |
75 (59.1%) |
33(51.6%) |
55 (45.1%) |
163 (52.1%) |
|
Female |
52(40.9%) |
31(48.4%) |
67 (54.9%) |
150 (47.9%) |
|
|
current marital status |
Single |
93(73.2%) |
53(82.8%) |
93 (76.2%) |
239(76.4%) |
|
Married |
32(25.2%) |
10 (15.6 %) |
24 (19.7%) |
66(21.1%) |
|
|
Divorce |
2(1.6%) |
1(1.6%) |
5 (4.1%) |
129 (41.2%) |
|
|
Religion |
Orthodox |
56 (44.1%) |
32 (50.5%) |
41 (33.6%) |
130 (41.5%) |
|
Muslim |
45 (35.4%) |
23 (35.9%) |
62 (50.8%) |
49 (15.7%) |
|
|
Protestant |
24 (18.9 %) |
6 (9.4%) |
19 (15.6%) |
5 (1.6 %) |
|
|
Catholic |
2 (1.6 %) |
3 (4.7%) |
0 (0.0%) |
23 (7.3%) |
|
|
Mothers Educational Status
|
Illiterate |
7 (5.5%) |
11 (17.2%) |
17 (13.9%) |
35 (11.2%) |
|
Read and Write |
20 (15.7%) |
8 (12.5%) |
15 (12.3%) |
43 (13.7%) |
|
|
Primary 1-8 |
50 (39.4 %) |
16 (25%) |
47 (38.5%) |
113 (36.1%) |
|
|
Secondary 9-10 |
17 (13.4%) |
15 (23.4%) |
25 (20.5%) |
57 (18.2%) |
|
|
Diploma |
19 (15 %) |
8 (12.5%) |
17 (13.9%) |
44 (14.1%) |
|
|
Degree and Above |
14 (11%) |
6 (9.4%) |
1 (0.8%) |
21 (6.7%) |
|
|
Illiterate |
7 (5.5%) |
11 (17.2%) |
17 (13.9%) |
35 (11.2%) |
|
|
Mothers Educational Status |
Read and Write |
20 (15.7%) |
8 (12.5%) |
15 (12.3%) |
43 (13.7%) |
|
Primary 1-8 |
50 (39.4 %) |
16 (25%) |
47 (38.5%) |
113 (36.1%) |
|
|
Secondary 9-10 |
17 (13.4%) |
15 (23.4%) |
25 (20.5%) |
57 (18.2%) |
|
|
Diploma |
19 (15 %) |
8 (12.5%) |
17 (13.9%) |
44 (14.1%) |
|
|
Degree andAbove |
14 (11%) |
6 (9.4%) |
1 (0.8%) |
21 (6.7%) |
|
|
Fathers Educational Status |
Illiterate |
10 (7.9%) |
8 (12.5%) |
16 (13.1%) |
34 (10.9%) |
|
Read and Write |
12 (9.4%) |
7 (10.9%) |
14 (11.5%) |
33 (10.5%) |
|
|
Primary 1-8 |
26 (20.5 %) |
12 (18.8%) |
28 (23%) |
66 (21.1%) |
|
|
Secondary 9 -10 |
33 (26%) |
15 (23.4%) |
28 (23%) |
75 (24.3%) |
|
|
Diploma |
18 (14.2 %) |
9 (14.1%) |
12 (9.8%) |
39 (12.5%) |
|
|
Degree and Above |
28 (22%) |
13 (20.3%) |
24 (19.7%) |
65 (20.8%) |
|
|
Current resident place |
Urban |
109 (85.8%) |
53 (82.8%) |
97 (79.5%) |
259 (82.7%) |
|
Rural |
18 (14.2%) |
11 (17.2% |
25 (20.5%) |
54 (17.3%) |
|
|
Departments |
Anesthesia |
5 (3.9%) |
1(1.6%) |
1 (0.8%) |
7(2.2%) |
|
Emergency |
6 (4.7%) |
0 (0.0%) |
0(0.0%) |
6(1.9%) |
|
|
HI |
8 (6.3%) |
8 (12.5%) |
6 (4.9%) |
22 (5.8%) |
|
|
Fathers Educational Status |
Midwifery |
14 (11%) |
6 (9.4%) |
21 (17.2%) |
41 (13.1%) |
|
MLS |
12 (9.4%) |
7 (10.9%) |
14 (11.5%) |
33 (10.5%) |
|
|
Nurse |
19 (15 %) |
11 (17.2%) |
33 (27%) |
63 (20.1%) |
|
|
Pediatrics |
4 (3.1%) |
0 (0.0%) |
1 (0.8%) |
5 (1.6%) |
|
|
Pharmacy |
35 (27.6 %) |
19 (29.7%) |
38 (31.1%) |
92 (29.4%) |
|
|
Public Health |
11 (8.7%) |
8 (12.5%) |
9 (7.4%) |
28 (8.9%) |
|
|
Fathers Educational Status |
Radiography |
6 (4.7%) |
4 (6.3%) |
4 (3.3%) |
14 (4.5%) |
|
Joined the field of study as per choice |
Yes |
118 (92.9%) |
58 (90.6%) |
108 (88.5%) |
284 (90.7%) |
|
Rural |
9 (7.1%) |
6 (9.4%) |
14 (11.5%) |
29 (9.3%) |
|
|
Like the field of study |
Yes |
120 (94.5%) |
60 (93.8%) |
114 (93.4%) |
294 (93.9%) |
|
No |
7 (5.5%) |
4 (6.3%) |
8 (6.6%) |
19 (6.1%) |
|
|
Year of Study |
First Year |
32 (25.2%) |
24 (37.5%) |
34 (27.9%) |
90 (28.8%) |
|
Second year |
40 (31.5%) |
14 (21.9%) |
32 (26.2%) |
86 (27.5%) |
|
|
Third year |
44 (34.6 %) |
19 (29.7%) |
42 (34.4%) |
105 (33.5%) |
|
|
Fourth year |
8 (6.3%) |
6 (9.4%) |
8 (6.6%) |
22 (7%) |
|
|
Fifth year |
3 (2.4%) |
1 (1.6%) |
6 (4.9%) |
10 (10%) |
|
Table 4: Baseline characteristics of students attending their studies at Harar Health Science College Harar, Eastern Ethiopia 2019 (n=313).
|
Item |
Strongly Disagree |
Disagree |
Neutral |
Agree |
Strongly Agree |
|
Teaching factor |
Frequency % |
Frequency % |
Frequency % |
Frequency % |
Frequency % |
|
Resources for procedures in skill lab room are not sufficiently available. |
105 (33.5%) |
70 (22.4%) |
20 (6.4%) |
104(32%) |
14 (4.5%) |
|
I feel that certain subjects are forced against my will |
69 (22%) |
99 (31.6%) |
15 (4.8%) |
56(17.9%) |
74 (23.6%) |
|
If my lectures asks me many questions every day |
58 (18.5%) |
81(25.9%) |
20(6.4%) |
105(33.5%) |
49 (15.7%) |
|
The changes in program do not taken into account in my care |
80 (25.6%) |
85 (27.2%) |
7(2.2%) |
18 (5.8%) |
123(39.3%) |
|
Shortage of the staff in the clinical area. |
27(8.6%) |
49 (15.7%) |
22(7%) |
150(47.9%) |
65 (20.8%) |
|
I do not understand the language of used by the Lecturer |
81(25.9) |
66(21.1%) |
32 (10.2%) |
85(27.2%) |
49 (15.7%) |
|
A boring subject. |
51 (16.3%) |
36 (11.5%) |
23 (7.3%) |
131(41.9%) |
72 (23%) |
Table 5: Distribution of the study sample about absenteeism reasons related to teaching factor among students attending their studies at Harar Health Science College Harar, Eastern Ethiopia 2019 (n=313).
|
Item |
Strongly Disagree |
Disagree |
Neutral |
Agree |
Strongly Agree |
|
Content Factor |
Frequency % |
Frequency % |
Frequency % |
Frequency% |
Frequency % |
|
If I am not explained the importance of attending full hours as training requirement |
62 (19.8%) |
58 (18.5%) |
18 (5.8%) |
92 (29.4%) |
83 (26.5%) |
|
The course outlines are not clear to me |
33(10.5%) |
59(18.8%) |
46 (14.7%) |
123(39.3%) |
52 (16.6%) |
|
Work overloading in the clinical area |
82 (26.2%) |
48(15.3%) |
110(35.1%) |
49 (15.7%) |
24(7.7%) |
|
I do not want to be treated as workforce. |
65 (20.8%) |
43 (13.7%) |
30 (9.1%) |
88 (28.1%) |
87 (27.8%) |
Table 6: Distribution of the study sample about absenteeism reasons related to content factor among students attending their studies at Harar Health Science College Harar, Eastern Ethiopia 2019 (n= 313).
|
Item |
Strongly Disagree |
Disagree |
Neutral |
Agree |
Strongly Agree |
|
Learning Environment |
Frequency% |
Frequency% |
Frequency% |
Frequency% |
Frequency% |
|
Because of poor discipline from high school. |
155 (49.5%) |
64 (20.4%) |
16 (5.1%) |
48(15.3%) |
30 (9.6 %) |
|
When I am lazy to do work. |
152 (48.6%) |
90 (28.8%) |
36 (11.5%) |
28 (8.9%) |
7 (2.2%) |
|
If I am late during lessons presentation |
67(21.4%) |
65(20.8%) |
2 (6%) |
70 (22.4%) |
109(34.8%) |
|
When lectures are absent. |
23 (7.3%) |
43(13.7%) |
26 (8.3%) |
55 (17.6%) |
166 (53%) |
Table 7: Distribution of the study sample about absenteeism reasons related to Learning Environment factor among students attending their studies at Harar Health Science College Harar, Eastern Ethiopia 2019 (n= 313).
|
Item |
Strongly Disagree |
Disagree |
Neutral |
Agree |
Strongly Agree |
|
Student assessment |
Frequency % |
Frequency % |
Frequency % |
Frequency % |
Frequency % |
|
When I am supposed to demonstrate procedures |
186 (48.6%) |
71(22.7%) |
27 (8.6%) |
18 (5.8%) |
11 (3.5%) |
|
I do not want to do presentations |
64 (20.4%) |
77 (24.6%) |
30 (9.6%) |
77 (24.6%) |
65 (20.8%) |
|
Poor performance in classroom |
153(48.9%) |
108(34.5%) |
10(3.2%) |
28 (8.9%) |
14 (4.5%) |
|
When I am not ready to write examination |
23 (7.3%) |
82 (26.2%) |
14(4.5%) |
42(13.7%) |
151(48.2%) |
|
When I am supposed to do feedback evaluation. |
62 (18.8%) |
71(22.7%) |
46(14.7%) |
101(32.2%) |
33(10.5%) |
|
When I am not ready n Objective Structured Clinical Evaluation (OSCE) |
137(43.8%) |
85 (27.2%) |
35(11.2%) |
39 (12.5%) |
17 (5.4%) |
Table 8: Distribution of the study sample about absenteeism reasons related to Student assessment factor among students attending their studies at Harar Health Science College Harar, Eastern Ethiopia 2019 (n= 313).
|
Variable |
Frequency |
Percent |
|
|
Do you have a absent from the class Room |
Yes |
186 |
59.4 |
|
No |
127 |
40.6 |
|
|
Not suitable learning program time |
44 |
14.1 |
|
|
The subject does not need teachers guidance (simplicity) |
13 |
4.2 |
|
|
Lack of interest to the subject |
7 |
2.2 |
|
|
Reason for Absenteeism |
Do not like teachers teaching style |
32 |
10.2 |
|
preparing for another examination |
68 |
21.7 |
|
|
Others |
22 |
7 |
|
Table 9: Proportion of student Absents and its main reason among student attending their studies at Harar Health Science College Harar, Eastern Ethiopia 2019 (n= 313).
|
Variable |
Frequency |
Percent |
|
|
Do you have a absent from the class Room |
Yes |
115 |
59.4 |
|
No |
198 |
69.3 |
|
|
Practical time are not convenient |
3 |
1 |
|
|
No couching teacher in practical site |
81 |
4.2 |
|
|
No couching teacher in practical site |
Practical area are not convenient to do practice |
11 |
2.2 |
|
Hospital staffs have negative altitude for students |
7 |
2.2 |
|
|
Others (practical time) |
13 |
4.2 |
|
Table 10: Proportion of student Absents and its main reason among student attending their studies at Harar Health Science College Harar, Eastern Ethiopia 2019 (n= 313).
Citation: Leta M, Haymanot GT, Yewendwosen E (2020) Determinant Factors Influencing Absenteeism among Ethiopian Health Science College Students. Int J Educ Adv: IJEA-100003.