Open Access Journal of Agriculture Research
Research Article
Global and Continental Legumes: Growth and Developments in Area, Production and Trade
Dastagiri MB*, Ch. Srinivasa Rao and Naga Sindhuja PV
ICAR-National Academy of Agricultural Research Management, Rajendranagar, Hyderabad, India
*Corresponding author: Dastagiri MB, ICAR-National Academy of Agricultural Research Management, Rajendranagar, Hyderabad, India, Tel: +919810619788; Email: dgiri_mb@yahoo.co.in
Citation: Dastagiri MB, Ch. Srinivasa Rao, Naga Sindhuja PV (2019) Global and Continental Legumes: Growth and Developments in Area, Production and Trade. Open Acc J Agri Res: OAJAR-100024.
Received date: 20 December 2019; Accepted date: 23 December 2019; Published date: 01 January 2020
Abstract
Globally, Legumes are vital crops for achieving food and nutritional security. This study analyzes global legumes growth and developments. The study period was 1990-91 to 2017-18. The compound annual growth rates, terms of trade, price elasticity’s, trends and instability analysis used. Globally and continent wise, soybean took the first position in area and production among selected legumes except groundnut in the African continent. So government should encourage the farmers to increase an area and production of legume crops without shifting to other commercial crops. Globally, TOT were found to be increased for beans, groundnut, and soybean. In Asia, during 1990-91 to 2017-18, the exports price of beans, chickpea, groundnut, peas, and soybean was more than imports price except lentil indicates comparative advantage of these crops. Globally, the export price elasticity of chickpea, lentil, and peas were found to be marginally higher than imports in the world. The import price elasticity of all legume crops were found to be marginally higher compared to exports in Asian continent but reverse trend noticed in other continents in some crops. After 2007-08, there was mixed trends in export and import price of all crops across the globe and regions. Self- sufficiency is not found in legume crops in all continents even many policies are existing under the pulse crops. Hence government should rectify those lags existing under the policies of legume crops. The study found that the import of all legume grains by the European continent was more than the export indicates no self-sufficiency for legumes in Europe. European continent is a global market for legumes. The export price of soybean and peas witnessed more or less linear trends in the world. The study suggests that multilateral trade relationship with high CAGR regions would help in smooth trade of legume crops.
Keywords: Continents; Development; Globe; Growth; Legumes; Trade;
Introduction
Legumes are valued worldwide as a sustainable and inexpensive meat alternative. Legumes are nutritionally valuable, providing proteins (20-45%) with essential amino acids, complex carbohydrates (± 60%) and dietary fibre (5-37%). Legumes play a critical role in natural ecosystems, agriculture, and agroforestry and economic and environmentally friendly crop, pasture, and tree species (PH Graham, 2003). Legumes are grown primarily for human consumption, livestock forage and silage, and as soil-enhancing green manure. Legumes are considered as a vital crop for achieving food and nutritional security for both poor producers and consumers. The global demand for pulse crops has increased from 42 million tonnes in 1980 to 81 million tonnes in 2016. However, per capita consumption has decreased from 10 kg per year in 1961 to 7 kg per year in 2013. Demand for pulses is expected to rise if incomes rise (International Legumes Society, 2019). Globally, Pulse prices are currently around 2 to 2.5 times higher than cereal prices (Food Security Portal.org). During the period of 2017-18, pulses were grown on 95.16 million ha worldwide with a total production of 95.98 million metric tonnes and an average productivity of 10085 kg/ha (FAO). Groundnut was grown on 27.94 million ha worldwide with a total production of 47.09 million metric tonnes and an average productivity of 16856 kg/ha during 2017-18. Soybean was grown on 123.55 million ha worldwide with a total production of 352.64 million metric tonnes and an average productivity of 28542 kg/ha during 2017-18 (FAO). The rate of increase in global pulse crop yields has lagged badly behind cereals, i.e., 630 kg/ha in 1960 to 1000 kg/ha currently for pulses, compared to 1500 kg/ha in 1960 for cereals to 4000 kg/ha (IFPRI).
Self-sufficiency ratio for pulses differs widely among regions, i.e., North America (3.0), European (1.0), and Asia (0.9). Goals of pulse improvement include a reduction in poverty, an increase in food security, an increase in nutrition, and an increase in soil health (International Legumes Society Conference, May 2019). During the period of 2017-18, the area under the cultivation of beans, chickpea, groundnut, lentils, peas and soybean in the African continent was 7.27, 0.45, 14.65, 0.19, 0.68, and 2.27 million ha with a total production of 6.85, 0.67, 12.30, 0.22, 0.64, and 3.13 million metric tonnes respectively. The area under the cultivation of beans, chickpea, groundnut, lentils, peas and soybean in the American continent was 7.32, 0.49, 1.45, 2.90, 2.35, and 2.35 million ha with a total production of 7.92, 0.67, 5.32, 4.09, 5.47, and 312.24 million metric tonnes respectively. The area under the cultivation of legumes such as beans, chickpea, groundnut, lentils, peas and soybean in the Asian continent was 21.40, 11.99, 11.83, 3.02, 2.14, and 19.33 million ha with a total production of 15.50, 10.87, 29.46, 2.78, 2.58 and 26.50 million metric tonnes respectively. Similarly, the area under the cultivation of beans, chickpea, groundnut, lentils, peas and soybean in the European continent was 0.43, 0.56, 0.0014, 0.24, 2.74, and 5.69 with a total production of 1.10, 0.56, 0.004, 0.28, 7.08, and 10.71 respectively (FAOSTAT).
Reviews of literature cited on area, production, exports-imports growth, price signals and instability of legumes. Over the past 14 years, the overall pulse production had increased at a rate higher than the growth rate in population both in developing and developed countries. Despite the rapid growth in exports and imports, pulse trade remained a relatively thin market compared to cereals and oil crops (Akibode, 2012). Ethiopia export earnings were estimated to be over 85 % of export earnings from pulses (Negash, 2007). The largest pulse producers were still in the developing countries and their share of the global pulse production was largely unchanged at around 70%. Grain legumes were traded in different forms such as kernels/seeds, cakes and meals, and oils. Among the legumes, exports in soybean had increased with 31% of soybean being traded, owing to increased demand from the feed sector, with Argentina, Brazil, and Paraguay emerging as major exporters [1]. Dry peas were ranked fourth in terms of world production of legumes below soybeans, peanuts, and dry beans. The increasing world population, mainly in the developing regions, was continuously driving the consumption demand for dry peas which also acted as a major driving force behind the growth of the peas market. Common bean yield loss due to drought was substantial, with almost all varieties experiencing a severe decline in yield (Katungi, 2010). In Africa, a common bean was a popular crop among small-scale farmers, given its short growth cycle (about 70 days) which permitted production when rainfall was erratic (Beebe, 2012). North America might see an uptick in demand for green lentils in the next crop year (Sean Pratt, 2019). Developing countries constituted 97% of the global area and 94% of the global production of this crop. The production of groundnut was concentrated in Asia and Africa (56% and 40% of the global area and 68% and 25% of the global production, respectively) [2]. Trade liberalization in groundnut markets had a strong South-South dimension with policies in India, and to a lesser extent China, heavily depressing the world prices of groundnut products at the expense of smaller developing countries mainly located in Africa. Under free trade, African exporters would gain because they are net sellers of groundnut products [3].
Economic precision is required on global geographical analysis of legumes scenario on area, production, international prices, imports, and exports. There are no or limited empirical studies on world trading research of global legumes. This study analyses an area, production trends and growth rates, trade scenario of imports exports and, prices of major legumes in the world.
Objectives
Materials and Methods
This is basically development in legumes and foreign trade research study. The area, production, export and import of major globally cultivated legume crops were selected for study purposes. The selected legume crops were beans, chickpea, groundnut, lentil, peas, and soybean. The study period is 1990-91 to 2017-18. Four continents such as African, American, Asian and European were selected for study since they occupied major areas and production of legume crops across the world. Data on area, production, quantity, values, and price of exports, imports of agricultural commodities were collected. Data sources were FAO STAT, DGCIS, CMIE Commodities and Planning commission reports. This research analysed the area, production and trade trends and growth rates, exports and import quantity and price growth rates, trends and elasticities of major legume crops. The research also estimated import-export and price elasticity’s, export market and price signals of legume crops globally. The compound annual growth rates (CAGR), price elasticity’s, instability and trends of exports and import price analysis were estimated using the following formulae.
Growth rate formulae: (Damodar N. Gujarati and Sangeetha, 2007): The compound growth rate (r) was calculated by fitting an exponential function to the variables of interest viz., exports, price for the period 1990-91to 2017-18.
Yt - Y0 (1+r) t ---------1
Assuming multiplicative error term in the equation1, model may be linearized by logarithmic transformation
lnYt = A+ Bt +€ ----------
Where, A (=lnAo) and B (=ln (1+r)) are the parameters to be estimated by ordinary least square regression, t= time trend in year, r = exp (B) -1
Price elasticity of exports formulae
ΣPe = % change in quantity exports/ % change in price
The percentage change in quantity exports is % ΔQ, and the percentage change in price is % ΔP. We calculated % ΔQ as ΔQ/Qave and we calculated % ΔP as ΔP/Pave. So, we calculated the price elasticity of exports as (ΔQ/ Qave)/(ΔP/Pave).
Instability Index Formulae
Coefficient of variation = (Standard Deviation / Mean) *100
Terms of Trade calculation
Terms of Trade (TOT) = Average Price of Exports/ Average Price of Imports
=Px/Pm
↑ Price M or ↓ Price X → Deterioration of TOT
↓ Price M or ↑ Price X → Improvement of TOT
Results and Discussions
Global and Continent Wise Trends in Area and Production of Legumes-(1990-2018)
Trends in Area of Legumes in World: In the world, there was an increasing trend in the area noticed during the period under soybean cultivation from Figure 1. Whereas, beans were slightly or stagnated up to 2001 then increasing trends during 2002 on wards butchickpea, groundnut, lentil, and peas stagnated all the years. The increased trend of the soybean area is observedwhen compared to other legume crops because soybean is the world’s most important seed legume, which contributes to 25 % of the global edible oil, about two-thirds of the world’s protein concentrate for livestock feeding.
Trends in Area of Legumes in the African Continent: Figure 2 shows the area under groundnut cultivation was recorded high in the African continent followed by beans from 2013-14 to 2017-18. The area under lentil and peas cultivation remained the same. There was a slightly increased in an area under the cultivation of soybean in recent years. Nearly half of the world’s groundnut growing area lies within the African continent, it is mainly beacause of the groundnut crop can be easily converted into cash, fetching the highest prices or income generating crop in Africa. Common bean is an important source of nutrition and food security for many African countries (CGIAR).
Trends in Area of Legumes in the American Continent: The area under soybean cultivation was found to be increasing trend from 1990-91 on wards to 2017-18 except 2007-08 in the American continent. The remaining crops were almost the same all over the years (from Figure 3). The area under the soybean cultivation was increased in the American conitnent is mainly due to increasing population, rapidly expanding markets for soy oil and meal,rapid growth in awareness of the many-faceted value of the soybean.
Trends in Area of Legumes in the Asian Continent: From figure 4 , the area under the cultivation of soybean and beans was shown an increasing trend while groundnut and chickpea shown mixed trend and peas and lentils were shown a decreasing trend of an area in the Asian continent from 1990-91 to 2017-18.
Soybean is one of the best choices where major expansion in production area appears feasible due to further rising demand in the vegetable oil and feed sub-sectors, improving farmer incomes and the sustainability of the production system. The cultivation of beans were more due to increasing in trade of drybean crop in the Asian continent.
Trends in Area of Legumes in the European Continent: Figure 5 shows that the area under cultivation of peas has drastically decreased trend from starting years in the European continent. There was an increasing trend recorded in the cultivation of soybean. Chickpea and lentil increased under area in recent years in the European. Pea, the most representative European grain legume has limited development prospects mainly due to unstable yields within years or sites (The magazine of the European Association for Grain Legume Research). Soybean used as source of protein for feeding animals and also for biofuel in European continent.
Global and Continent Wise Trends in Production of Legumes (1990-2018)
Trends in Production of Legumes in World: Figure 6 shows that the maximum production was found to be high in soybean crop followed by groundnut and beans in the world among the selected legumes globally. There was an increasing trend of production noticed under soybean crop in the world. Due to multiple uses of soybean, the crop has grown in all continents in the world.
Trends in production of Legumes in the African Continent: From figure 7 it was observed that the higher and rising trend of production in legume crops was found in groundnut followed by beans and soybean in the African continent. The farmers in the African continent rise the production of groundnut to prevent the hunger and poverty since this was the main crop which generated income mainly for African farmers.
Trends in Production of Legumes in the American Continent: From figure 8 soybean is the only crop which has shown a rising trend and higher production in the American continent. The results represented that soybean is a major cultivating crop in American continent where adequate moisture is available for successful crop production.
Trends in Production of Legumes in the Asian Continent: Figure 9 shows that major fluctuations in the production of legume crops have been recorded in the Asian continent. Groundnut and soybean production were at the top position and showed increasing and decreasing mixed trends during 1990-2018.
Trends in Production of Legumes in the European Continent: Figure 10-20 showed that there had an increasing trend observed in soybean production in the European continent. The peas production had declined gradually over the years but it was increased in recent years. Beans and lentil production recorded the same all over the years.
Global and Continent-Wise Growth Rates of Area and Production of Legumes (1990-91 to 2017-18):
Global and Continent Wise Growth Rate of Legume Area in World: The continent wise growth rate of legumes area in the world was presented in Table 1. During 1990-91 to 2017-18, the area under the cultivation of soybean (2.89) was found to be high in the world followed by lentil (2.68). The negative value recorded under the area of peas in the world due to severe drought. During the period of 1990-91 to 2017-18, the area under lentil in the American continent, chickpea in European and peas in the American continent were more which accounted for 9.41, 7.42 and 7.29 respectively. During the same period, the area under groundnut and peas in the European was very low which accounted for -8.99 and -2.73 respectively.
Global and Continent Wise Growth Rate of Legume Production in World: The continent wise growth rate of legume production in the world was represented in Table 2. During the period of 1990-91 to 2017-18, the production of all legume crops was high except lentil which accounted for -0.09. The maximum production among all legume crops in the world was soybean followed by peas. During 1990-91 to 2017-18, the production was more in lentil and peas in the American continent which accounted to be 9.94 and 9.05 respectively. Groundnut and peas production in European was observed to be very low such as -6.39 and -2.27 respectively.
Global and Continent Wise Average Export Import Price of Legume Crops (1990-91 to 2017-18):
Average Export-Import Price of Legume crops in the Asian Continent: The average export-import price and TOT of legume crops in Asia were presented in Table 3. During the period of 1990-91 to 2017-18, the export price of beans, chickpea, groundnut, peas, and soybean was more than import price except lentil. It indicates that the Asian continent has the comparative advantage of these crops. During the period of 1990-91 to 2000-01, the export price of chickpea, groundnut, lentil, peas, and soybean was higher than the import price of the same crops except beans. During the period of 2001-02 to 2011-12, the export price of beans, chickpea, groundnut, lentil, and peas were more than import price except soybean. During the period of 2012-13 to 2017-18, the export price of chickpea, peas, and soybean was more than import price except for beans, groundnut, and lentil which import price was higher than their import price. During the period 1990-91 to 2017-18, the terms of trade of Asia with other continents found to be improved for all legume crops except lentil crop.???????
The study found that the export price of legume crops for beans, chickpea, groundnut, peas, and soybean were higher than import price except lentil crop. The terms of trade of the Asian continent legumes were found to be increased for all legumes except lentil crop.
Average Export-Import Price of Legume crops in the African Continent: The average export-import price and TOT of legume crops in Africa were presented in Table 4. During the period of 1990-91 to 2017-18, the export price of beans, lentil, and peas was higher than their import price except chickpea, groundnut, and soybean. It means that the African continent has a comparative advantage of these crops. During 1990-91 to 2000-01, the export price of beans, groundnut, lentil, peas, and soybean were higher than their import price except chickpea. During 2001-02 to 2011-12, the export price of beans, groundnut, and lentil was higher than their import price except for chickpea, peas, and soybean. From 2012-13 to 2017-18, the export price of beans, chickpea, and lentil was higher than their import price except for groundnut, peas, and soybean. During the period 1990-91 to 2017-18, the terms of trade of Africa with other continents found to be improved for beans, lentils, and peas.
The study was found that the export price of legume crops for beans, lentil and peas were more than their import price. The terms of trade of African continent legumes were found to be increased for beans, lentils, and peas.
Average Export-Import Price of Legume crops in the American Continent: The average export-import price and TOT of legume crops in the American continent were presented in Table 5. During the period of 1990-91 to 2017-18, the export price of beans, groundnut, and soybean was more than their import price. It represents that the American continent has a comparative advantage of these crops.
During 1990-91 to 2000-01, the import price of all legumes were higher than their export price except beans and groundnut. The export price of groundnut, peas, and soybean was more than their import price from 2001-02 to 2011-12. The price of all legumes did not rise except lentil from 2012-13 to 2017-18. During the period 1990-91 to 2017-18, the terms of trade of America with other continents found to be improved for beans, groundnut, and soybean.
The study was found that the export price of legume crops for beans, groundnut and soybean was more than their import price in the American continent. The terms of trade of American continent legumes were found to be increased for beans, groundnut, and soybean.
Average Export-Import Price of Legume crops in the European Continent: The average export-import price and TOT of legume crops in the European continent were presented in Table 6. It was noticed that the import price of all legumes was more than that of their export price. It means that self-sufficiency for legumes is not found in European continent.
During 1990-91 to 2000-01, the import price of all legumes in European was more than their export price except peas. During 2001-02 to 2011-12, the import prices of all legumes were higher than their export price. During 2012-13 to 2017-18, the export price of chickpea, groundnut, and soybean were more than their import price.
The study implied that the import of all legume grains by European continent was more than the export. It means there is no self-sufficiency for legume grains in this continent. Deterioration in terms of trade has been noticed in the European continent since imports of legumes were found to be more than their export price.
Average Export-Import Price of Legume crops in World: The average export-import price and TOT of legume crops in the world were presented in Table 7. During 1990-91 to 2017-18, the export price of beans, groundnut, and soybean in the world was more than their import price. The export price of groundnut and soybean in the world was more than their import price from 1990-91 to 2000-01. The export price of all legumes were found to be more than their import price except chickpea and lentil during 2001-02 to 2011-12. In the world, the export price of chickpea, groundnut, and lentil was found to be more than their import price from 2012-13 to 2017-18.
The study found that world export price of beans, groundnut, and soybean in the world was more than their import price. The terms of trade were found to be increased for beans, groundnut, and soybean.
Global and Continent Wise Growth rate and Instability of Export-Import Quantities and Price of Legumes (1990-91 to 2017-18):
Growth rate and Instability of Export-Import Quantities and Price of Legumes in the Asian Continent:The annual compound growth rates and coefficient of variation of export-import quantity and prices of global major legumes in the Asian continent were presented in Table 8. During 1990-91 to 2017-18, both export and import price growth rates of all legume crops were found to be positive in the Asian continent. The export price growth rate of peas was more than the imports price growth rate, while the reverse trend was seen in beans, chickpea, groundnut, lentil and soybean crops. Further, it was noticed that among the legume crops, lentil import price (12.75 %) and peas export price (12.49 %) growth rate was more than compared to other legume export-import prices in Asia. During 1990-91 to 2017-18, the export import quantity growth of all legume crops were found to be positive except chickpea (-1.03%) and soybean (-2.06%) quantity in the Asian continent. The export quantity growth rate of peas was more than the import quantity growth while remaining crops has shown a reverse trend quantity growth in the Asian continent.
During the period 1990-91 to 2017-18, the variation in import price of all legume crops was found to be more than compared to the export price except peas where export price (89.22) variation which was more than import price growth rate (85.01). It was observed that the export price of all legume crops was found to be stable. The import price of chickpea (121.70) was found to be unstable. During 1900-91 to 2017-18, the variation in import quantity of all legumes were found to be more than compared to export quantity.The export and import quantities were found to be stable in Asia.
The study revealed that import legumes price and quantity growth rate were more except peas price growth. The results showed that variation in import price and quantity were found to be more than the export price and quantity. The export and import price and quantity were found to be stable except chickpea import price which was unstable. The export and import quantities were found to be stable in the Asian continent.
Growth rate and Instability of Export-Import Quantities and Price of Legumes in the American continent:The annual compound growth rates and coefficient of variation of export import quantity and prices in the American continent were presented in Table 9. During 1990-91 to 2017-18, both export and import price and quantity growth rates of all legume crops were found to be positive in the American continent. The export price and quantity growth rate of all legumes were found to be more than the import price growth rate but the reverse trend has been found in groundnut price and quantity growth rate in the American continent (which accounted for 6.29%, and 4.98% respectively).
During 1990-91 to 2017-18, variation in export price of chickpea, lentil, peas, and soybean was observed to be more than their import price but a reverse trend has been noticed in the case of beans and groundnut. The variation in export quantity of all legumes was observed to be more than the import quantity except beans where the import quantity (33.06) was found to be more than the export quantity (11.67). The results show that the export and import quantity of all legumes was stable. The export and import price of all legumes was stable except lentils export price which was unstable (102.36) in the American continent.
The study found that export price and quantity were found to be more than the import price and quantity growth rate except for groundnut in the American continent. The variation in export price of chickpea, lentil, peas, and soybean was observed to be more than their import price except beans and groundnut. The variation in the export quantity of all legumes was observed to be more than the import quantity except beans. The export and import quantity of all legumes were stable. The export and import price of all legumes was stable except lentils export price in the American continent.
Growth Rate and Instability of Export Import Quantities and Price of Legumes in the African Continent: The annual compound growth rates and coefficient of variation of export-import quantity and prices of global major legumes in the African continent were presented in Table 10. During 1990-91 to 2017-18, both export and import price and quantity growth rate of all legumes were positive except lentils export quantity (-1.55%).
From Table 10, it was clearly shown that the export price and quantity growth rate of beans, chickpea and soybean were found to be more than the import price and quantity growth rate but a reverse trend was noticed in the groundnut, lentils, and peas.
During 1990-91 to 2017-18, the variation in export price and quantity of all legumes was more than the import price and quantity except groundnut where the variation in import price (66.46) and quantity (38.26) were more than the export price (59.26) and quantity (37.59). The export price of groundnut, lentil, and peas was stable whereas the export price of beans (110.16), chickpea (103.04) and soybean (134.55) was unstable in the African continent. The export quantity of soybean was unstable (129.56).
The study found that export price and quantity growth rate of beans, chickpea and soybean were found to be more than the import but a reverse trend was noticed in the groundnut, lentils, and peas. The variation in export price and quantity of all legumes was found to be more than the import price and quantity except groundnut. The export price of beans and chickpea were unstable. The export price and quantity of soybean were unstable in the African continent.
Growth Rate and Instability of Export Import Quantity and Price of Legumes in the European continent: The annual compound growth rates and coefficient of variation of export import quantity and prices of global major legumes in the European continent were presented in Table 11. During 1990-91 to 2017-18, both export and import price and quantity growth rate were found to be positive whereas peas import price (-3.10%) and quantity (-3.73%) were negative. The export price and quantity growth rate of all legumes were observed to be more than the import price and quantity growth rate.
During 1990-91 to 2017-18, the variation in export price of all legumes was found to be more than the import price but a reverse trend had been noticed in the case of beans where the variation in import price (36.77) which was higher than the export price (36.24).The variation in the export quantity of all legumes was found to be more than their import quantities except peas where the variation in import quantity (51.91) was seen higher than the export quantity (39.74). The export price (137.06) and quantity of chickpea (136.55) were unstable in the European continent.
The study found that negative peas import price and quantity had been found in the European continent from 1990-91 to 2017-18.The export price and quantity growth rate of all legumes were observed to be more than the import price and quantity growth rate. The variation in the export price of all legumes was more than the import price except beans. The variation in the export quantity of all legumes was observed to be more than their import quantities except peas. The chickpea export price and quantity were unstable in the European continent.
Growth rate and Instability of Export-Import Quantity and Price of Legumes in World: The annual compound growth rates and coefficient of variation of export import quantity and prices of global major legumes in the world were presented in Table 12. During 1990-91 to 2017-18, both export and import price and quantity were found to be positive. The export price growth rate of beans, groundnut, and peas was observed to be more than the import price growth rate but there was a reverse trend noticed in the case of chickpea, lentil, and soybean. The import quantity growth rate of all legumes was found to be more than the export except soybean where the export quantity (8.86%) growth rate was higher than the import quantity (8.60%). During 1990-91 to 2017-18, the variation in export price of beans, groundnut, and soybean were observed to be more than the import price. The same was reversed in the case of chickpea, lentil, and peas. The variation in the import quantity of all legumes was seen maximum than the export quantity except groundnut (23.57) and soybean (53.61). Both export and import price and quantities of all legumes were stable in the world.
The study found that the export price growth rate of beans, groundnut, and peas was observed to be more than the import but there was a reverse trend noticed in the case of chickpea, lentil, and soybean. The import quantity growth rate of all legumes was observed to be more than the export except soybean. The variation in export price of beans, groundnut, and soybean was observed to be more than the import price except it was reverse in the case of chickpea, lentil, and peas. The variation in the import quantity of all legumes was found to be more than the export quantity except groundnut and soybean. Both export and import price and quantities of all legumes were stable in the world.
Global and Continent-wise Exports-Imports Price Elasticity of Legumes (1990-91 to 2017-18): How responsive are export & Import quantities to a change in international prices is of direct relevance in international economics. Trade price elasticities are signals for exporters or importers to increase or decrease their trade as it indicates exports or imports responsiveness to changes in price.
Export Import Price Elasticities of Legumes in the Asian Continent: Export import price elasticities of global major legumes were presented in Table 13. During the period 1990-91 to 2017-18, the export import price elasticities of all legumes were found to be positive except chickpea (-0.23) and soybean (-1.19) exports. The import price elasticity of beans (0.31), chickpea (0.43), groundnut (0.50), lentil (0.70), peas (1.00) and soybean (0.61) were found to be marginally higher when compared to exports.
Export Import Price Elasticities of Legumes in the American Continent: Export import price elasticities of global major legumes in the American continent were presented in Table 14. During the period 1990-91 to 2017-18, the export import price elasticities of all legumes were found to be positive. The export price elasticities of chickpea (0.58), lentil (0.64), and peas (0.87) were found to be marginally higher than the imports. Whereas in other legume crops, the import price elasticity was found to be marginally higher than the exports.
The study found that the export price elasticity of chickpea, lentil, and peas were marginally higher when compared to imports in the American continent.
Export Import Price Elasticities of Legumes in the African Continent: Export import price elasticities of global major legumes in the African continent were presented in Table 15. During the period 1990-91 to 2017-18, the export import price elasticities of all legumes were found to be positive except for lentil exports (-0.95). The export price elasticities of chickpea (0.57), groundnut (0.75) and soybean (0.50) were found to be marginally higher than the imports. Whereas, the import price elasticity of beans (0.77), lentil (0.44) and peas (0.80) was found to be marginally higher than the exports.
The study found that the export price elasticity of chickpea, groundnut, and soybean were marginally higher when compared to imports in the African continent.
Export Import Price Elasticities of Legumes in the European Continent: Export import price elasticities of global major legumes in the European continent were presented in Table 16. During the period 1990-91 to 2017-18, the export import price elasticities of all legumes were found to be positive. The export price elasticities of beans (0.75), chickpea (0.56), groundnut (0.51), lentil (0.61), peas (3.50) and soybean (0.68) were found to be marginally higher than the imports.
Export Import Price Elasticities of Legumes in the world: Export import price elasticities of global major legumes in the world were presented in Table 17. During the period 1990-91 to 2017-18, the export import price elasticities of all legumes were found to be positive. The export price elasticities of chickpea (0.51), lentil (0.69), and peas (1.00) were found to be marginally higher than the imports. But in remaining crops, the import price elasticity was found to be marginally higher than the exports in the world.
The study revealed that the export price elasticity of chickpea, lentil, and peas were found to be marginally higher than imports in the world.
Global and Continent- wise Trends in Export and Import Price of Legumes (1990-91 to 2017-18):
Trends in Export Price of Legumes in World: The export price of all legumes was more or less stable in the world up to 2007-08, later the export price of all legumes showed mixed trends. The export price of groundnut and beans were witnessed increasing trends after 2007-08. The export price of chickpea was witnessed mixed trends but increasing trends observed in 1995-96 and 2017-18. The export price of soybean and peas were witnessed more or less linear trends in the world.
Trends in Export Price of Legumes in the Asian Continent:The export price of all legumes except chickpea was more or less stable up to 2005-06 after that increasing trends were witnessed in chickpea, groundnut, beans and soybean except lentil and peas up to 2012-13. Except for chickpea, all other legume crops had shown decreasing trends after 2016-17 in the Asian continent.
Trends in Export Price of Legumes in the African continent: The export price of soybean, beans were shown less or more linear trends whereas the export price of chickpea, lentil and peas were witnessed mixed trends in the African continent.
Trends in Export Price of Legumes in the American Continent: The export price of all legume crops had witnessed less or more linear trends up to 2006-07. After that, the export price of soybean and peas was shown less or more stable trends whereas groundnut, beans, chickpea, and lentil were witnessed mixed trends in the American continent.
Trends in Export Price of Legumes in the European Continent: The export price of soybean and peas crops were witnessed more or less stable trends from 1990-91 to 2017-18. But, the export price of groundnut, lentil, beans, and chickpea had witnessed mixed trends.
Trends in Import Price of Legumes in the World: The import price of all legumes were witnessed more or less stable trends up to 2006-07. After 2006-07, the import price of all legumes was shown increasing with mixed trends. Higher fluctuations were observed in the import price of groundnut, lentil, beans, and chickpea.
Trends in import price of Legumes in the Asian Continent: The linear trends had been noticed in the import price of all legumes up to 2006-07. The import prices of groundnut, beans, lentil, and chickpea were witnessed increasing mixed trends in the Asian continent. More or less stable trends were reported in the import price of soybean and peas.
Trends in Import Price of Legumes in the African Continent:The export price of all legumes was found to be more or less stable up to 2006-07. After 2006-07, the import price of all legumes were witnessed increasing with mixed trends. Higher fluctuations were observed in the import price of groundnut, lentil, and chickpea.
Trends in Import Price of the American Continent: The import price of all legumes had witnessed increasing with mixed trends after 2007-08. The import price of soybean and peas were witnessed more or less linear trends. Higher fluctuations were noticed in the case of groundnut, lentil, chickpea, and beans import price.
Trends in Import Price of Legumes in the European Continent: The import price of all legumes were shown increasing with mixed trends after 2007-08. During the period of 1990-91 to 2017-18, the import price of soybean and peas were more or less stable trends whereas the import price of beans, chickpea, groundnut, and lentil had witnessed mixed trends. Higher fluctuations were reported in groundnut, peas, and lentil.
Conclusion
Legumes are considered as a vital crop for achieving food and nutritional security for both producers and consumers. Global geographical analysis of legumes scenario is important. Global and continental wise Soybean took the first position in area and production among the selected legume grains except the African continent where the groundnut area was more than other legume grain crops [4-6]. This is mainly due to multiple uses of soybean. Globally, the growth rate of soybean area and production was found to be more followed by lentils. During the period of 1990-91 to 2017-18, the growth rate of lentil area in the American continent, chickpea in European and peas in the American continent were found to be more. The production growth rate was more in lentil and peas in the American continent. The terms of trade of the Asian continent legumes were found to be increased for all legumes except lentil crop. Whereas in African continent legumes were found to be increased for beans, lentils, and peas. And in American continent legumes were found to be increased for beans, groundnut, and soybean. The study found that the import of all legume grains by European continent was more than the export. It means there is no self-sufficiency for legume grains in this continent.
Deterioration in terms of trade has been noticed in the European continent since imports of legumes were found to be more than their export price. Globally, the terms of trade were found to be increased for beans, groundnut, and soybean.
The study found that variation in import price and quantity were found to be more than the export price and quantity. The export and import price and quantity were found to be stable except chickpea import price which was unstable in the Asian continent. Export price and quantity were found to be more than the import price and quantity growth rate except for groundnut in the American continent [7-10]. The export price and quantity growth rate of all legumes were observed to be more than the import price and quantity growth rate. The variation in the export price of all legumes was more than the import price except beans. The variation in the export quantity of all legumes was observed to be more than their import quantities except peas. The chickpea export price and quantity were unstable in the European continent [11-13].
Globally, the export price growth rate of beans, groundnut, and peas was observed to be more than the import but there was a reverse trend noticed in the case of chickpea, lentil, and soybean. The import quantity growth rate of all legumes was observed to be more than the export except soybean. The variation in the import quantity of all legumes was found to be more than the export quantity except groundnut and soybean. Both export and import price and quantities of all legumes were stable in the world.
The study found that the import price elasticity of beans, chickpea, groundnut, lentil, peas, and soybean were found to be marginally higher when compared to exports in the Asian continent. The export price elasticity of chickpea, lentil, and peas were marginally higher when compared to imports in the American continent. And the export price elasticity of chickpea, groundnut, and soybean were marginally higher when compared to imports in the African continent. In case of European continent, the export price elasticity of all legumes were found to be marginally higher than imports. The study revealed that the export price elasticity of chickpea, lentil, and peas were found to be marginally higher than imports in the world [14].
The export price of soybean and peas has witnessed more or less linear trends in the world. More or less stable trends were reported in the import price of soybean and peas. The export price of soybean, beans were shown less or more linear trends whereas the export price of chickpea, lentil and peas have witnessed mixed trends in the African continent. the export price of soybean and peas was shown less or more stable trends whereas groundnut, beans, chickpea, and lentil have witnessed mixed trends in the American continent. Globally, the import price of all legumes was shown increasing with mixed trends. The import prices of groundnut, beans, lentil, and chickpea have witnessed increasing mixed trends in the Asian continent [15-18]. More or less stable trends were reported in the import price of soybean and peas. The import prices of groundnut, beans, lentil, and chickpea have witnessed increasing mixed trends in the Asian continent. More or less stable trends were reported in the import price of soybean and peas. The import price of all legumes were witnessed increasing with mixed trends in the African continent. The import price of soybean and peas have witnessed more or less linear trends in the American continent. During the period of 1990-91 to 2017-18, the import price of soybean and peas were more or less stable trends whereas the import price of beans, chickpea, groundnut, and lentil have witnessed mixed trends. Higher fluctuations were reported in groundnut, peas, and lentil.
Suggestions
The study could better guide exporters and importers regions for market and price signals of commodities.
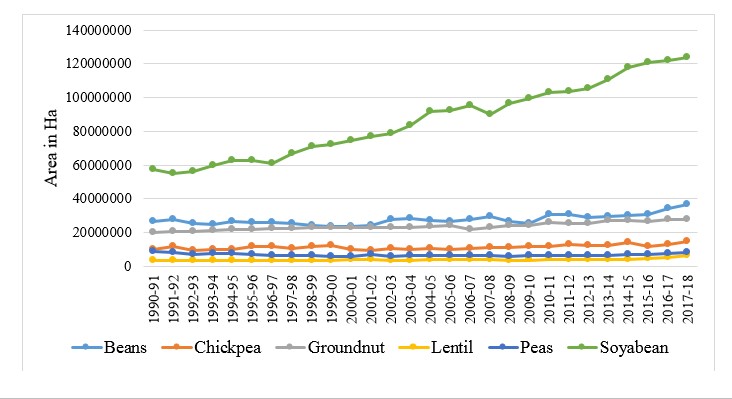
Figure 1: Trends in Area of Legumes in the Asian Continent.
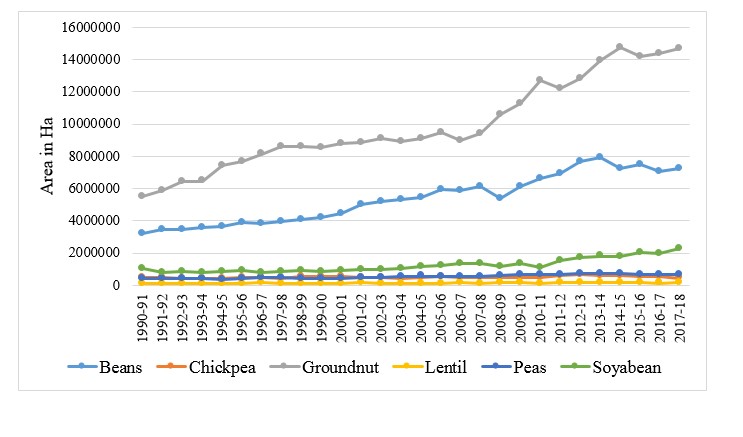
Figure 2: Trends in Area of Legumes in the African Continent.
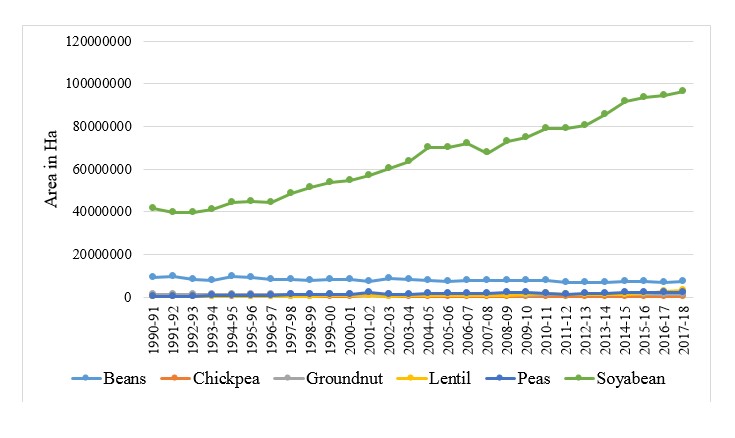
Figure 3: Trends in Area of Legumes in the American Continent.
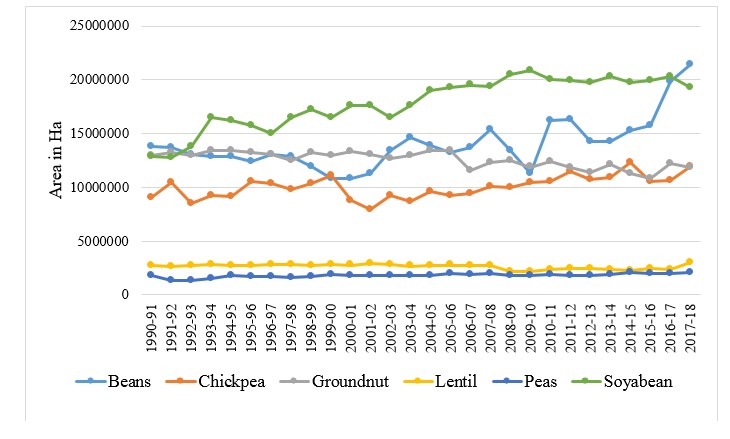
Figure 4: Trends in Area of Legumes in the Asian Continent.

Figure 5: Trends in Area of Legumes in the European Continent.
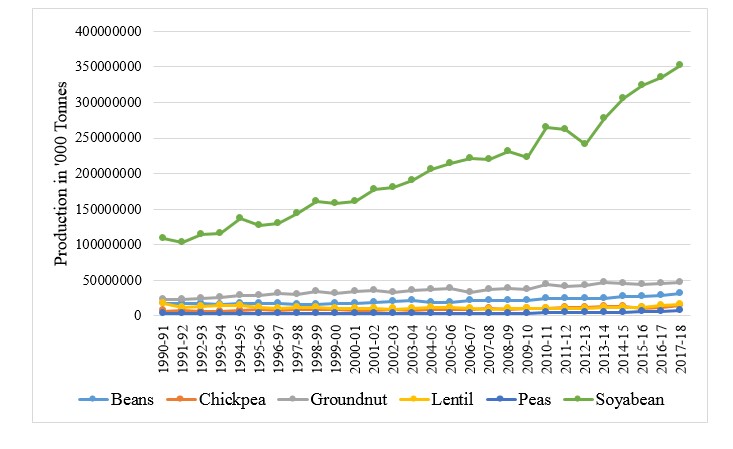
Figure 6: Trends in the Production of Legumes in World.
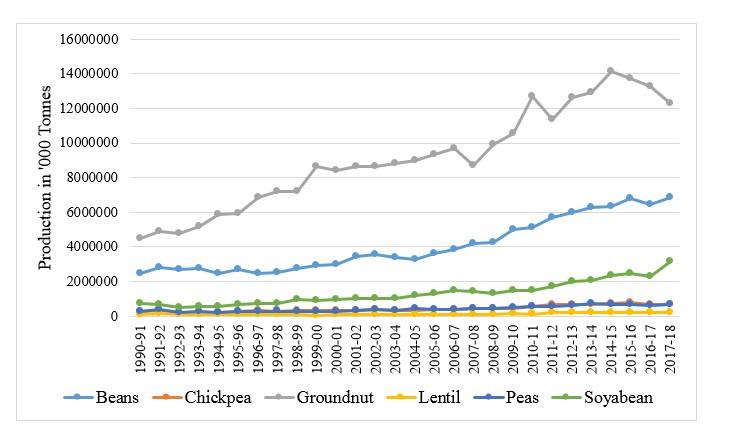
Figure 7: Trends in Production of Legumes in the African Continent.
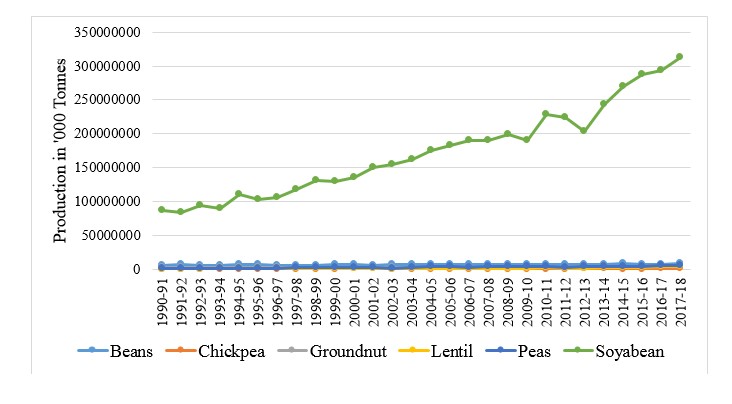
Figure 8: Trends in Production of Legumes in the American Continent.
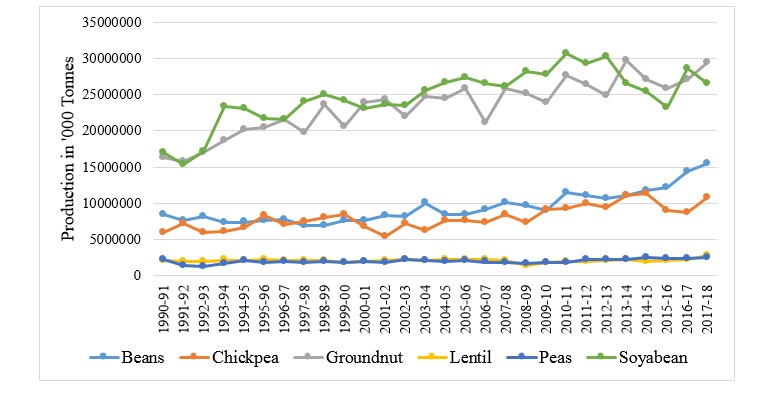
Figure 9: Trends in Production of Legumes in the Asian Continent.
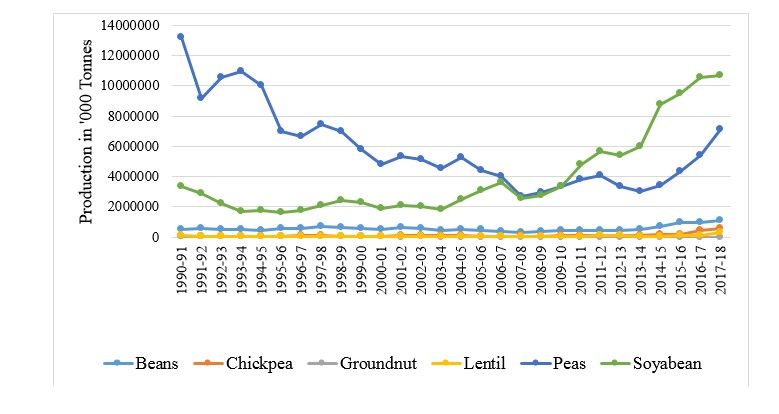
Figure 10: Trends in Production of Legumes in the European Continent.
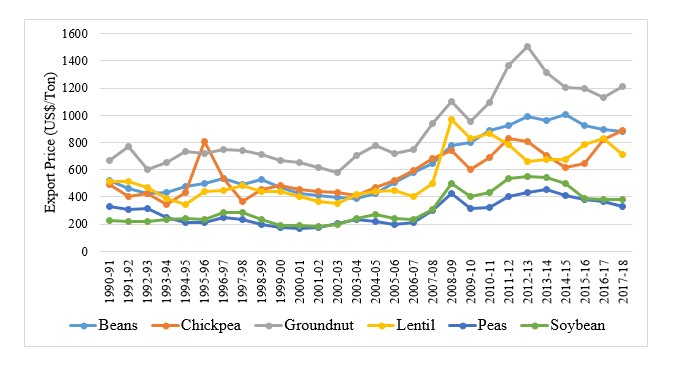
Figure 11: Export Price of Legumes in World.
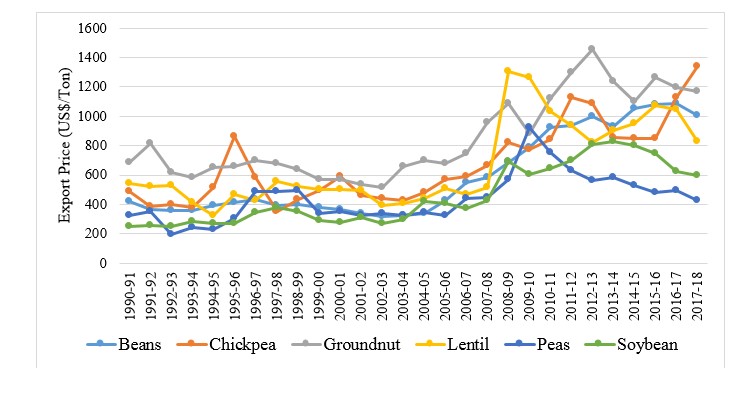
Figure 12: Export Price of Legumes in the Asian Continent.
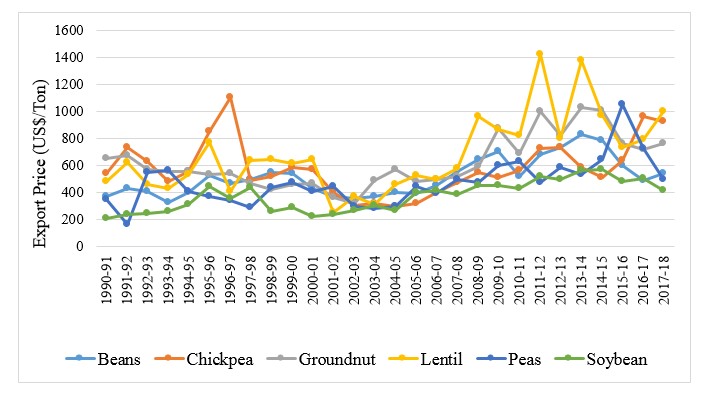
Figure 13: Export Price of Legumes in the African Continent.
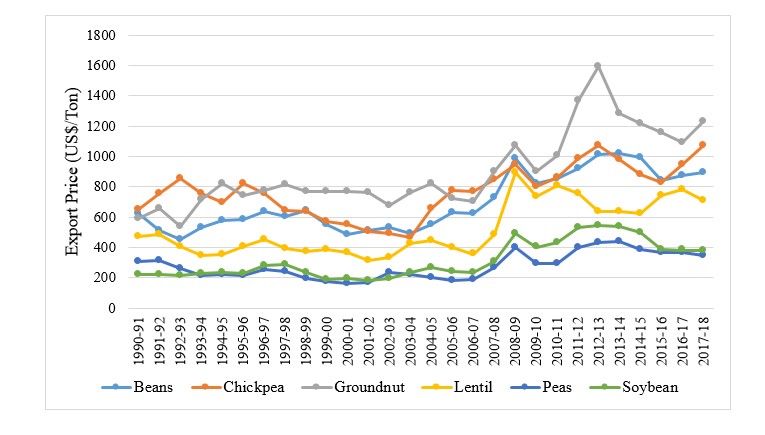
Figure 14: Export Price of Legumes in the American continent.
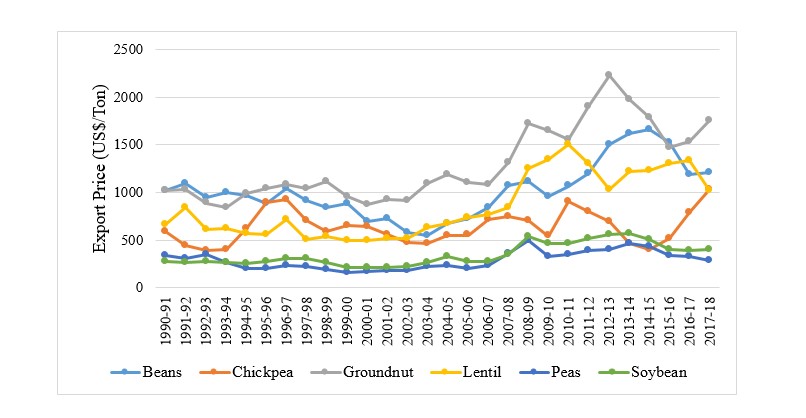
Figure 15: Export Price of Legumes in the European Continent.
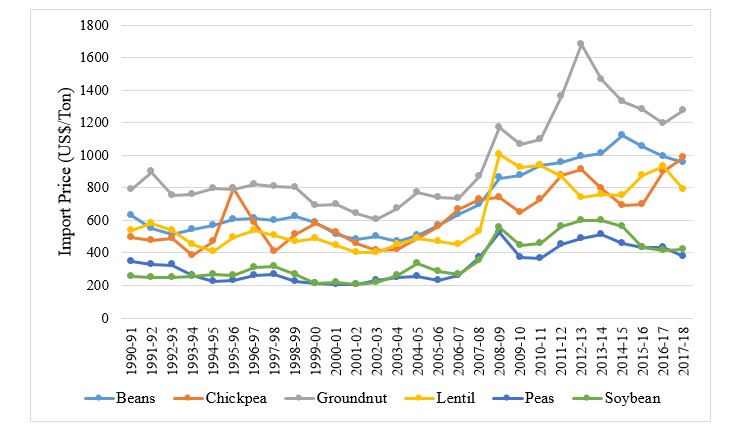
Figure 16: Import Price of Legumes in the World.
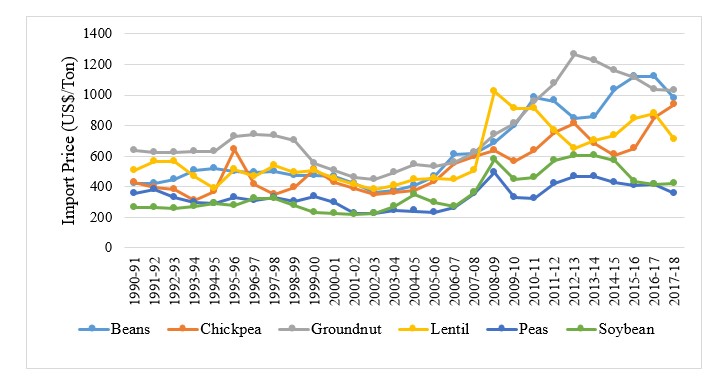
Figure 17: Import Price of Legumes in the Asian Continent.
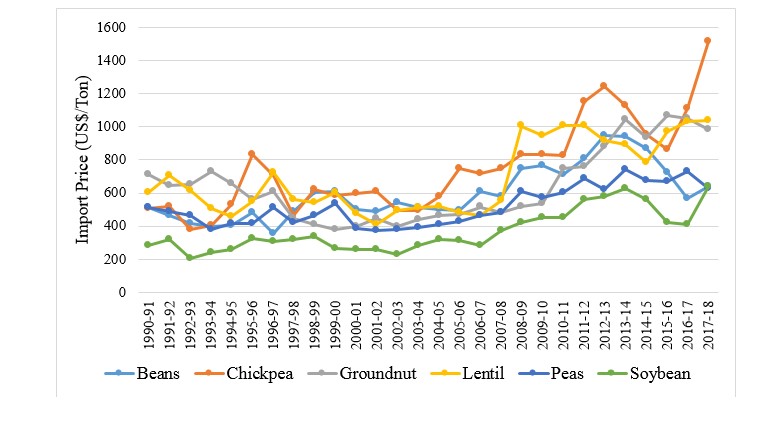
Figure 18: Import Price of Legumes in the African Continent.
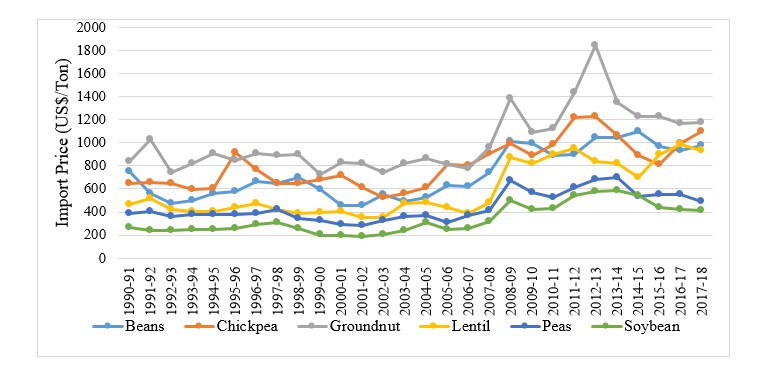
Figure 19: Import Price of Legumes in the American Continent.
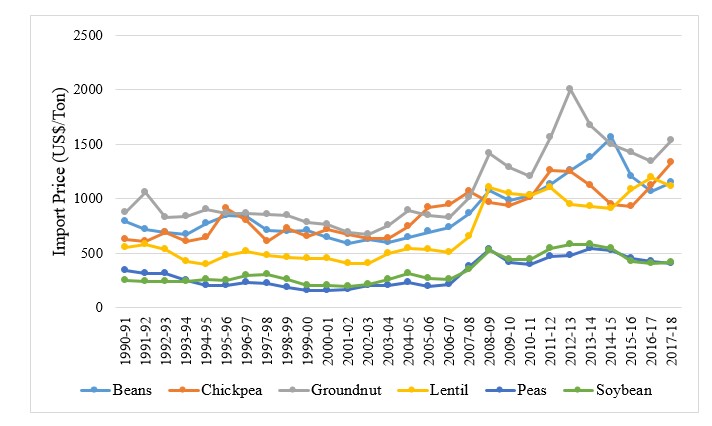
Figure 20: Import Price of Legumes in the European Continent.
|
Continent |
Crops |
1990-91 to 2000-01 |
2001-02 to 2011-12 |
2012-13 to 2017-18 |
1990-91 to 2017-18 |
|
ASIAN |
Beans |
-2.34 |
3.80 |
8.45 |
1.64 |
|
|
Chickpea |
-0.23 |
3.73 |
2.26 |
1.06 |
|
|
Groundnut |
0.22 |
-0.94 |
0.71 |
-0.35 |
|
|
Lentil |
0.30 |
-1.63 |
4.00 |
0.40 |
|
|
Peas |
0.18 |
0.35 |
3.28 |
0.59 |
|
|
Soybean |
3.20 |
1.26 |
-0.44 |
1.51 |
|
AMERICAN |
Beans |
-1.12 |
-0.56 |
1.17 |
-0.78 |
|
|
Chickpea |
10.12 |
-11.70 |
7.09 |
3.82 |
|
|
Groundnut |
-1.14 |
-1.01 |
2.37 |
0.61 |
|
|
Lentil |
12.15 |
4.52 |
19.18 |
9.41 |
|
|
Peas |
14.79 |
-5.53 |
4.60 |
7.29 |
|
|
Soybean |
2.81 |
3.33 |
3.66 |
3.17 |
|
AFRICAN |
Beans |
3.33 |
3.34 |
-1.06 |
3.09 |
|
|
Chickpea |
1.15 |
1.68 |
-7.58 |
-0.11 |
|
|
Groundnut |
4.83 |
3.24 |
2.66 |
3.71 |
|
|
Lentil |
1.11 |
2.65 |
-0.26 |
1.96 |
|
|
Peas |
0.93 |
3.16 |
-1.34 |
1.94 |
|
|
Soybean |
-1.39 |
4.75 |
5.75 |
2.94 |
|
EUROPEAN |
Beans |
-2.43 |
-4.89 |
11.25 |
-0.61 |
|
|
Chickpea |
1.96 |
0.34 |
35.18 |
7.42 |
|
|
Groundnut |
-4.99 |
-20.23 |
-5.11 |
-8.99 |
|
|
Lentil |
-10.97 |
8.03 |
17.91 |
2.13 |
|
|
Peas |
-10.56 |
0.26 |
7.18 |
-2.73 |
|
|
Soybean |
-5.31 |
11.12 |
10.55 |
4.32 |
|
WORLD |
Beans |
-1.07 |
2.43 |
4.58 |
1.18 |
|
|
Chickpea |
0.24 |
3.16 |
3.40 |
1.43 |
|
|
Groundnut |
1.62 |
0.84 |
1.79 |
1.29 |
|
|
Lentil |
1.89 |
0.49 |
9.44 |
2.68 |
|
|
Peas |
-3.64 |
-1.04 |
4.25 |
-0.25 |
|
|
Soybean |
2.65 |
3.06 |
3.23 |
2.89 |
Table 1: Growth Rate of Legumes Area in World – Continent Wise (1990-91 to 2017-18).
|
Crops |
Variables |
Average Export – Import Price US$/Ton |
Terms of Trade |
||||||
|
1990-91 to 2000-01 |
2001-02 to 2011-12 |
2012-13 to 2017-18 |
1990-91 to 2017-18 |
1990-91 to 2000-01 |
2001-02 to 2011-12 |
2012-13 to 2017-18 |
1990-91 to 2017-18 |
||
|
Beans |
Export |
-1.40 |
10.83 |
0.10 |
3.30 |
-1.43 |
1.25 |
0.03 |
1.04 |
|
Import |
0.98 |
8.64 |
2.88 |
3.16 |
|||||
|
Chickpea |
Export |
1.83 |
9.45 |
4.29 |
3.80 |
36.6 |
1.37 |
1.53 |
1.28 |
|
Import |
0.05 |
6.87 |
2.80 |
2.97 |
|||||
|
Groundnut |
Export |
-1.76 |
9.23 |
-4.20 |
2.02 |
0.79 |
1.04 |
1.05 |
1.12 |
|
Import |
-2.23 |
8.81 |
-4.01 |
1.80 |
|||||
|
Lentil |
Export |
-0.79 |
6.51 |
0.16 |
1.06 |
0.72 |
1.02 |
0.08 |
0.83 |
|
Import |
-1.10 |
6.39 |
1.80 |
1.28 |
|||||
|
Peas |
Export |
0.69 |
6.72 |
-5.28 |
1.00 |
-0.38 |
1.04 |
0.97 |
- |
|
Import |
-1.79 |
6.46 |
-5.41 |
0.00 |
|||||
|
Soybean |
Export |
1.08 |
8.46 |
-5.92 |
3.27 |
-0.68 |
0.83 |
0.91 |
1.90 |
|
Import |
-1.59 |
10.21 |
-6.90 |
1.72
|
|||||
|
Source: Directorate of Economics and Statistics, FAOSTAT. |
|||||||||
Table 2: Growth Rate of Legume Production in World – Continent Wise (1990-91 to 2017-18).
|
Crops |
Variables |
Average Export – Import Price US$/Ton |
Terms of Trade |
||||||
|
1990-91 to 2000-01 |
2001-02 to 2011-12 |
2012-13 to 2017-18 |
1990-91 to 2017-18 |
1990-91 to 2000-01 |
2001-02 to 2011-12 |
2012-13 to 2017-18 |
1990-91 to 2017-18 |
||
|
Beans |
Export |
1.60 |
6.28 |
-5.87 |
1.45 |
-8.42 |
1.21 |
0.76 |
1.75 |
|
|
Import |
-0.19 |
5.21 |
-7.69 |
0.83 |
||||
|
Chickpea |
Export |
0.55 |
6.18 |
4.72 |
2.03 |
0.32 |
0.93 |
1.15 |
0.48 |
|
|
Import |
1.73 |
6.65 |
4.08 |
4.16 |
||||
|
Groundnut |
Export |
-3.36 |
10.68 |
-1.40 |
0.58 |
0.59 |
1.94 |
-0.64 |
0.47 |
|
|
Import |
-5.62 |
5.49 |
2.18 |
1.22 |
||||
|
Lentil |
Export |
2.90 |
18.67 |
4.55 |
2.74 |
-1.23 |
1.98 |
1.77 |
1.35 |
|
|
Import |
-2.36 |
9.43 |
2.57 |
2.03 |
||||
|
Peas |
Export |
1.54 |
0.67 |
-3.19 |
1.30 |
-0.56 |
0.11 |
-11.39 |
1.66 |
|
|
Import |
-2.72 |
6.24 |
0.28 |
0.78 |
||||
|
Soybean |
Export |
0.71 |
7.95 |
-3.68 |
2.61 |
-0.79 |
0.97 |
-1.75 |
0.84 |
|
|
Import |
-0.89 |
8.19 |
2.10 |
3.10 |
||||
|
Source: FAOSTAT. |
|||||||||
Table 3: Average Export-Import Price of Legume crops in Asian Continent (1990-91 to 2017-18).
|
Crops |
Variables |
Average Export – Import Price US$/Ton |
Terms of Trade |
||||||
|
1990-91 to 2000-01 |
2001-02 to 2011-12 |
2012-13 to 2017-18 |
1990-91 to 2017-18 |
1990-91 to 2000-01 |
2001-02 to 2011-12 |
2012-13 to 2017-18 |
1990-91 to 2017-18 |
||
|
Beans |
Export |
1.60 |
6.28 |
-5.87 |
1.45 |
-8.42 |
1.21 |
0.76 |
1.75 |
|
|
Import |
-0.19 |
5.21 |
-7.69 |
0.83 |
||||
|
Chickpea |
Export |
0.55 |
6.18 |
4.72 |
2.03 |
0.32 |
0.93 |
1.15 |
0.48 |
|
|
Import |
1.73 |
6.65 |
4.08 |
4.16 |
||||
|
Groundnut |
Export |
-3.36 |
10.68 |
-1.40 |
0.58 |
0.59 |
1.94 |
-0.64 |
0.47 |
|
|
Import |
-5.62 |
5.49 |
2.18 |
1.22 |
||||
|
Lentil |
Export |
2.90 |
18.67 |
4.55 |
2.74 |
-1.23 |
1.98 |
1.77 |
1.35 |
|
|
Import |
-2.36 |
9.43 |
2.57 |
2.03 |
||||
|
Peas |
Export |
1.54 |
0.67 |
-3.19 |
1.30 |
-0.56 |
0.11 |
-11.39 |
1.66 |
|
|
Import |
-2.72 |
6.24 |
0.28 |
0.78 |
||||
|
Soybean |
Export |
0.71 |
7.95 |
-3.68 |
2.61 |
-0.79 |
0.97 |
-1.75 |
0.84 |
|
|
Import |
-0.89 |
8.19 |
2.10 |
3.10 |
||||
|
Source: FAOSTAT |
|||||||||
Table 4: Average Export-Import Price of Legume crops in the African continent (1990-91 to 2017-18).
|
Crops |
Variables |
Average Export – Import Price US$/Ton |
Terms of Trade |
||||||
|
1990-91 to 2000-01 |
2001-02 to 2011-12 |
2012-13 to 2017-18 |
1990-91 to 2017-18 |
1990-91 to 2000-01 |
2001-02 to 2011-12 |
2012-13 to 2017-18 |
1990-91 to 2017-18 |
||
|
Beans |
Export |
-2.51 |
6.04 |
-2.38 |
1.36 |
0.52 |
0.86 |
1.75 |
1.42 |
|
|
Import |
-4.83 |
7.02 |
-1.36 |
0.96 |
||||
|
Chickpea |
Export |
-1.59 |
6.90 |
-0.04 |
1.87 |
-1.54 |
0.96 |
0.02 |
0.95 |
|
|
Import |
1.03 |
7.16 |
-2.26 |
1.97 |
||||
|
Groundnut |
Export |
2.58 |
5.99 |
-5.02 |
2.74 |
-17.2 |
1.04 |
0.58 |
2.19 |
|
|
Import |
-0.15 |
5.78 |
-8.57 |
1.25 |
||||
|
Lentil |
Export |
-2.48 |
9.19 |
2.22 |
1.54 |
1.73 |
0.87 |
0.96 |
0.58 |
|
|
Import |
-1.43 |
10.52 |
2.30 |
2.64 |
||||
|
Peas |
Export |
-6.14 |
8.88 |
-4.20 |
0.49 |
2.22 |
1.11 |
0.66 |
0.53 |
|
|
Import |
-2.76 |
8.01 |
-6.33 |
0.92 |
||||
|
Soybean |
Export |
-1.53 |
11.47 |
-7.01 |
1.97 |
0.55 |
1.04 |
1.08 |
1.16 |
|
|
Import |
-2.77 |
11.06 |
-6.48 |
1.70
|
||||
|
Source: FAOSTAT. |
|||||||||
Table 5: Average Export-Import Price of Legume crops in the American Continent (1990-91 to 2017-18).
|
Crops |
Variables |
Average Export – Import Price US$/Ton |
Terms of Trade |
||||||
|
1990-91 to 2000-01 |
2001-02 to 2011-12 |
2012-13 to 2017-18 |
1990-91 to 2017-18 |
1990-91 to 2000-01 |
2001-02 to 2011-12 |
2012-13 to 2017-18 |
1990-91 to 2017-18 |
||
|
Beans |
Export |
-3.74 |
5.19 |
-4.37 |
0.62 |
1.83 |
0.76 |
2.40 |
0.44 |
|
|
Import |
-2.04 |
6.79 |
-1.82 |
1.40 |
||||
|
Chickpea |
Export |
0.93 |
3.67 |
8.31 |
2.11 |
0.71 |
0.57 |
6.34 |
0.75 |
|
|
Import |
1.31 |
6.46 |
1.31 |
2.81 |
||||
|
Groundnut |
Export |
-1.56 |
7.50 |
-4.63 |
2.04 |
1.14 |
0.88 |
0.90 |
0.96 |
|
|
Import |
-1.37 |
8.51 |
-5.13 |
2.11 |
||||
|
Lentil |
Export |
-2.71 |
9.76 |
-0.08 |
1.64 |
1.33 |
0.93 |
-0.02 |
0.63 |
|
|
Import |
-2.03 |
10.45 |
3.15 |
2.60 |
||||
|
Peas |
Export |
-6.81 |
8.11 |
-7.07 |
-0.71 |
0.93 |
0.73 |
2.22 |
-1.07 |
|
|
Import |
-7.29 |
10.97 |
-3.19 |
0.66 |
||||
|
Soybean |
Export |
-2.68 |
9.13 |
-6.34 |
1.34 |
1.44 |
0.86 |
0.97 |
0.71 |
|
|
Import |
-1.86 |
10.55 |
-6.49 |
1.90
|
||||
|
Source: FAOSTAT |
|||||||||
Table 6: Average Export-Import Price of Legume crops in the European continent (1990-91 to 2017-18.
|
Crops |
Variables |
Average Export – Import Price US$/Ton |
Terms of Trade |
||||||
|
1990-91 to 2000-01 |
2001-02 to 2011-12 |
2012-13 to 2017-18 |
1990-91 to 2017-18 |
1990-91 to 2000-01 |
2001-02 to 2011-12 |
2012-13 to 2017-18 |
1990-91 to 2017-18 |
||
|
Beans |
Export |
-2.09 |
8.53 |
-2.32 |
1.94 |
1.03 |
1.19 |
3.27 |
1.25 |
|
|
Import |
-2.03 |
7.14 |
-0.71 |
1.55 |
||||
|
Chickpea |
Export |
-0.80 |
6.61 |
1.88 |
2.23 |
-1.21 |
0.97 |
1.17 |
0.85 |
|
|
Import |
0.66 |
6.76 |
1.61 |
2.61 |
||||
|
Groundnut |
Export |
-0.14 |
8.31 |
-4.22 |
2.25 |
0.11 |
1.07 |
0.78 |
1.26 |
|
|
Import |
-1.29 |
7.76 |
-5.35 |
1.78 |
||||
|
Lentil |
Export |
-2.37 |
7.95 |
1.54 |
1.19 |
1.30 |
0.98 |
1.11 |
0.83 |
|
|
Import |
-1.82 |
8.04 |
1.39 |
1.45 |
||||
|
Peas |
Export |
-6.52 |
8.46 |
-5.62 |
-0.01 |
1.27 |
1.05 |
1.12 |
-0.31 |
|
|
Import |
-5.12 |
8.05 |
-5.05 |
0.32 |
||||
|
Soybean |
Export |
-1.55 |
11.36 |
-6.98 |
1.96 |
0.92 |
1.07 |
1.05 |
1.05 |
|
|
Import |
-1.69 |
10.55 |
-6.67 |
1.87 |
||||
|
Source: FAOSTAT. |
|||||||||
Table 7: Average Export-Import Price of Legume crops in World (1990-91 to 2017-18).
|
Crops |
Variables |
Quantity Growth Rate % |
Price Growth Rate% |
||||||
|
1990-91 to 2000-01 |
2001-02 to 2011-12 |
2012-13 to 2017-18 |
1990-91 to 2017-18 |
1990-91 to 2000-01 |
2001-02 to 2011-12 |
2012-13 to 2017-18 |
1990-91 to 2017-18 |
||
|
Beans |
Exports |
3.63 (14.55) |
3.89 (19.77) |
-10.71 (26.65) |
1.22 (32.82) |
2.18 (16.16) |
15.14 (56.07) |
-10.62 (22.38) |
4.56 (66.00) |
|
Imports |
0.08 (9.14) |
6.86 (25.59) |
1.12 (5.40) |
3.41 (41.25) |
1.06 (14.20) |
16.09 (56.52) |
4.03 (15.82) |
6.68 (75.30) |
|
|
Chickpea |
Exports |
-10.81 (39.60) |
-1.61 (9.70) |
-3.39 (32.04) |
-1.03 (29.50) |
-9.18 (26.04) |
7.68 (29.84) |
0.76 (20.06) |
2.74 (46.26) |
|
Imports |
3.55 (42.96) |
0.04 (20.60) |
20.52 (43.63) |
9.20 (79.42) |
3.61 (30.83) |
6.92 (39.97) |
23.89 (61.15) |
12.45 (121.70) |
|
|
Groundnut |
Exports |
0.23 (18.39) |
4.63 (19.43) |
0.00 (7.62) |
1.37 (21.35) |
-1.53 (22.20) |
14.28 (48.70) |
-4.20 (12.60) |
3.41 (52.15) |
|
Imports |
0.47 (16.77) |
4.22 (14.91) |
15.06 (29.92) |
3.70 (30.28) |
-1.77 (22.64) |
13.40 (47.49) |
10.44 (21.74) |
5.56 (58.91) |
|
|
Lentil |
Exports |
1.23 (24.77) |
-0.18 (30.59) |
12.75 (27.29) |
2.41 (27.62) |
0.43 (22.98) |
6.32 (37.66) |
12.94 (29.17) |
4.06 (47.03) |
|
Imports |
10.07 (38.56) |
8.87 (39.68) |
17.53 (26.79) |
11.33 (93.56) |
8.87 (37.25) |
15.83 (71.89) |
19.64 (32.65) |
12.75 (111.84) |
|
|
Peas |
Exports |
6.20 (29.88) |
14.77 (49.25) |
11.80 (23.52) |
11.38 (78.94) |
6.93 (55.76) |
22.49 (59.16) |
5.89 (15.01) |
12.49 (89.22) |
|
Imports |
-0.5 (28.77) |
7.74 (37.14) |
15.11 (27.71) |
8.87 (85.01) |
-2.28 (29.88) |
14.70 (37.14) |
8.89 (27.71) |
8.87 (85.01) |
|
|
Soybean |
Exports |
-9.20 (59.45) |
0.29 (26.17) |
4.84 (13.58) |
-2.06 (44.95) |
-8.21 (49.49) |
8.78 (44.29) |
-1.37 (9.88)
|
1.15 (49.26) |
|
Imports |
10.16 (34.20) |
9.33 (32.35) |
10.03 (18.49) |
9.92 (76.07) |
8.41 (29.03) |
20.50 (62.40) |
2.44 (6.42) |
11.81 (95.61)
|
|
|
Source: FAOSTAT. |
|||||||||
Table 8: Growth rate and Instability of Export-Import Quantities and Price of Legumes in the Asian Continent (1990-91 to 2017-18).
|
Crops |
Variables |
Quantity Growth Rate % |
Price Growth Rate% |
||||||
|
1990-91 to 2000-01 |
2001-02 to 2011-12 |
2012-13 to 2017-18 |
1990-91 to 2017-18 |
1990-91 to 2000-01 |
2001-02 to 2011-12 |
2012-13 to 2017-18 |
1990-91 to 2017-18 |
||
|
Beans |
Exports |
1.03 (13.73) |
1.95 (11.29) |
2.90 (11.67) |
2.14 (21.31) |
-1.5 (19.83) |
8.11 (34.64) |
0.44 (7.74) |
3.53 (45.01) |
|
Imports |
1.04 (30.70) |
2.03 (10.95) |
-5.25 (15.80) |
1.90 (33.06) |
-3.84 (39.44) |
9.20 (37.52) |
-6.54 (15.87) |
2.87 (55.65) |
|
|
Chickpea |
Exports |
18.29 (71.71) |
-4.61 (26.30) |
9.07 (31.35) |
9.18 (62.52) |
16.41 (58.10) |
1.97 (26.09) |
9.03 (38.98) |
11.22 (80.93) |
|
Imports |
3.06 (14.36) |
2.52 (14.57) |
16.23 (30.83) |
6.07 (51.33) |
4.12 (20.58) |
9.86 (39.45) |
13.61 (34.85) |
8.15 (72.31) |
|
|
Groundnut |
Exports |
3.47 (23.92) |
4.13 (40.35) |
7.88 (8.78) |
3.03 (56.20) |
6.14 (19.00) |
10.37 (20.14) |
2.47 (17.01) |
5.86 (31.86) |
|
Imports |
11.69 (35.40) |
1.91 (12.58) |
4.84 (10.98) |
4.98 (28.88) |
11.53 (33.72) |
7.8 (36.16) |
-4.15 (14.89) |
6.29 (48.37) |
|
|
Lentil |
Exports |
12.08 (33.39) |
8.52 (42.94) |
8.15 (24.53) |
8.96 (79.76) |
9.30 (28.06) |
18.50 (73.96) |
10.54 (30.34) |
10.64 (102.36) |
|
Imports |
9.29 (31.44) |
3.53 (13.11) |
8.70 (18.35) |
6.18 (37.37) |
7.73 (27.17) |
14.42 (50.17) |
11.19 (24.88) |
8.98 (70.70) |
|
|
Peas |
Exports |
19.92 (54.72) |
4.59 (36.02) |
8.91 (15.87) |
9.58 (57.63) |
12.55 (38.99) |
13.88 (56.22) |
4.34 (13.24) |
10.12 (79.21) |
|
Imports |
5.00 (20.49) |
-0.72 (10.77) |
12.20 (25.21) |
4.71 (38.65) |
2.11 (18.05) |
7.23 (30.41) |
5.10 (16.55) |
5.67 (57.85) |
|
|
Soybean |
Exports |
6.45 (20.07) |
4.77 (19.95) |
9.50 (16.37) |
6.82 (53.67) |
4.82 (22.85) |
16.78 (56.53) |
1.82 (6.34) |
8.93 (81.02) |
|
Imports |
15.40 (39.72) |
-4.21 (16.01) |
10.51 (17.20) |
6.68 (31.41) |
12.20 (43.03) |
6.38 (33.53) |
3.34 (14.32) |
8.50 (53.68)
|
|
|
Source: FAOSTAT, Figure in parenthesis indicates the CV (independent of unit). |
|||||||||
Table 9: Growth rate and Instability of Export-Import Quantities and Price of Legumes in the American continent (1990-91 to 2017-18).
|
Crops |
Variables |
Quantity Growth Rate % |
Price Growth Rate% |
||||||
|
1990-91 to 2000-01 |
2001-02 to 2011-12 |
2012-13 to 2017-18 |
1990-91 to 2017-18 |
1990-91 to 2000-01 |
2001-02 to 2011-12 |
2012-13 to 2017-18 |
1990-91 to 2017-18 |
||
|
Beans |
Exports |
-2.21 (28.29) |
15.79 (50.32) |
15.26 (25.33) |
6.81 (96.96) |
-0.65 (28.51) |
23.07 (75.28) |
8.49 (19.03) |
8.36 (110.16) |
|
Imports |
7.86 (39.65) |
9.32 (23.11) |
7.65 (14.50) |
6.67 (32.90) |
7.65 (33.48) |
15.02 (39.84) |
-0.63 (13.02) |
7.55 (50.58) |
|
|
Chickpea |
Exports |
-0.13 (73.33) |
19.72 (38.58) |
0.83 (7.42) |
12.18 (83.03) |
0.42 (62.19) |
27.12 (51.38) |
5.60 (31.24) |
14.46 (103.04) |
|
Imports |
6.72 (36.82) |
-0.51 (14.84) |
2.58 (17.22) |
4.50 (37.79) |
8.57 (48.15) |
6.10 (34.98) |
6.76 (26.55) |
8.85 (67.52) |
|
|
Groundnut |
Exports |
0.91 (23.85) |
-0.64 (21.60) |
2.33 (20.96) |
2.61 (37.59) |
-2.48 (20.24) |
9.97 (49.03) |
0.90 (13.36) |
3.21 (59.26) |
|
Imports |
9.89 (44.94) |
3.67 (15.01) |
-5.28 (22.02) |
6.69 (38.26) |
3.71 (48.27) |
9.35 (32.33) |
-3.22 (18.45) |
7.99 (66.46) |
|
|
Lentil |
Exports |
-13.20 (77.33) |
-12.98 (68.45) |
-18.81 (46.24) |
-1.55 (79.40) |
-10.68 (72.21) |
3.27 (92.52) |
-15.11 (51.00) |
1.15 (97.00) |
|
Imports |
6.41 (31.66) |
1.62 (18.94) |
6.92 (13.83) |
3.18 (32.78) |
3.90 (27.64) |
11.21 (42.72) |
9.66 (19.78) |
5.28 (55.00) |
|
|
Peas |
Exports |
-5.39 (71.95) |
10.89 (52.93) |
-14.03 (38.20) |
4.47 (82.33) |
-3.94 (88.19) |
11.64 (72.04) |
-16.77 (34.04) |
5.82 (99.96) |
|
Imports |
13.15 (37.98) |
6.98 (27.97) |
4.89 (19.00) |
9.04 (57.23) |
10.08 (40.92) |
13.66 (41.96) |
5.19 (18.68) |
9.89 (70.36) |
|
|
Soybean |
Exports |
27.88 (86.03) |
12.30 (103.80) |
16.09 (74.91) |
17.59 (129.56) |
28.79 (77.90) |
21.22 (114.83) |
11.81 (59.92) |
20.67 (134.55) |
|
Imports |
22.63 (49.79) |
11.92 (45.48) |
-5.10 (15.93) |
12.47 (77.20) |
21.54 (53.23) |
21.09 (69.82) |
-3.11 (9.88) |
15.95 (97.03) |
|
|
Source: FAOSTAT, Figure in parenthesis indicates the CV (independent of unit). |
|||||||||
Table 10: Growth rate and Instability of Export-Import Quantities and Price of Legumes in African continent (1990-91 to 2017-18).
|
Crops |
Variables |
Quantity Growth Rate % |
Price Growth Rate% |
||||||
|
1990-91 to 2000-01 |
2001-02 to 2011-12 |
2012-13 to 2017-18 |
1990-91 to 2017-18 |
1990-91 to 2000-01 |
2001-02 to 2011-12 |
2012-13 to 2017-18 |
1990-91 to 2017-18 |
||
|
Beans |
Exports |
3.35 (15.73) |
2.99 (17.45) |
8.02 (19.48) |
2.89 (26.12) |
-0.51 (9.35) |
8.33 (24.62) |
3.30 (12.30) |
3.53 (36.24) |
|
Imports |
0.76 (3.95) |
1.21 (6.39) |
0.11 (2.23) |
0.87 (10.52) |
-1.29 (8.85) |
8.08 (30.30) |
-1.71 (15.05) |
2.28 (36.77) |
|
|
Chickpea |
Exports |
9.87 (36.55) |
16.93 (64.70) |
4.46 (29.38) |
12.84 (136.55) |
10.89 (56.13) |
21.21 (81.25) |
13.14 (33.69) |
15.22 (137.06) |
|
Imports |
3.07 (13.19) |
-0.89 (13.60) |
6.21 (11.86) |
3.01 (19.46) |
4.43 (21.53) |
5.51 (28.71) |
7.60 (24.33) |
5.90 (42.87) |
|
|
Groundnut |
Exports |
3.41 (38.98) |
11.59 (32.02) |
3.96 (6.47) |
5.47 (37.80) |
1.80 (40.46) |
19.95 (57.22) |
-0.85 (12.96) |
7.62 (62.29) |
|
Imports |
0.97 (8.40) |
2.49 (9.17) |
4.30 (6.88) |
2.25 (19.08) |
-0.41 (12.42) |
11.21 (37.95) |
-1.04 (11.87) |
4.41 (49.54) |
|
|
Lentil |
Exports |
3.32 (18.60) |
6.40 (15.70) |
20.72 (52.35) |
7.60 (65.22) |
0.51 (13.29) |
16.79 (45.80) |
20.61 (44.00) |
9.36 (88.55) |
|
Imports |
3.79 (14.17) |
0.22 (5.83) |
6.56 (12.33) |
2.61 (13.29) |
1.68 (7.73) |
10.70 (42.43) |
9.92 (21.14) |
5.28 (49.72) |
|
|
Peas |
Exports |
-6.30 (19.99) |
1.11 (26.55) |
17.36 (47.68) |
1.05 (39.74) |
-12.69 (39.24) |
9.31 (26.97) |
9.06 (29.26) |
0.33 (44.84) |
|
Imports |
-0.98 (12.47) |
-7.89 (48.90) |
0.67 (16.63) |
-3.73 (51.91) |
-8.20 (29.63) |
2.22 (24.91) |
-2.54 (19.11) |
-3.10 (39.63) |
|
|
Soybean |
Exports |
11.82 (61.06) |
6.24 (18.58) |
7.14 (21.79) |
10.27 (68.79) |
8.83 (58.51) |
15.93 (46.56) |
0.34 (12.26) |
11.75 (88.45) |
|
Imports |
0.86 (8.43) |
-2.77 (10.98) |
3.58 (7.67) |
0.65 (10.64) |
-1.01 (13.09) |
7.49 (29.37) |
-3.14 (10.96) |
2.56 (36.52)
|
|
|
Source: FAOSTAT, Figure in parenthesis indicates the CV (independent of unit). |
|||||||||
Table 11: Growth rate and Instability of Export-Import Quantity and Price of Legumes in the European continent (1990-91 to 2017-18).
|
Crops |
Variables |
Quantity Growth Rate % |
Price Growth Rate% |
||||||
|
1990-91 to 2000-01 |
2001-02 to 2011-12 |
2012-13 to 2017-18 |
1990-91 to 2017-18 |
1990-91 to 2000-01 |
2001-02 to 2011-12 |
2012-13 to 2017-18 |
1990-91 to 2017-18 |
||
|
Beans |
Exports |
2.50 (11.71) |
3.825 (16.81) |
-1.90 (5.89) |
2.41 (26.42) |
0.36 (14.70) |
12.68 (47.48) |
-4.18 (8.60) |
4.39 (56.89) |
|
Imports |
1.12 (8.93) |
4.34 (15.76) |
-0.14 (3.57) |
2.71 (28.89) |
-0.93 (12.48) |
11.80 (41.98) |
-0.84 (5.62) |
4.30 (55.71) |
|
|
Chickpea |
Exports |
5.36 (28.51) |
1.08 (17.07) |
9.61 (24.09) |
7.32 (63.67) |
4.52 (22.02) |
7.76 (36.23) |
11.67 (35.72) |
9.71 (90.32) |
|
Imports |
3.73 (27.86) |
-0.01 (14.87) |
18.01 (37.00) |
7.90 (63.80) |
4.41 (19.17) |
6.74 (33.98) |
19.92 (50.94) |
10.72 (95.86) |
|
|
Groundnut |
Exports |
1.48 (9.80) |
13.20 (15.48) |
-0.96 (8.74) |
4.68 (23.57) |
7.47 (13.87) |
5.37 (45.18) |
14.24 (7.89) |
7.65 (53.47) |
|
Imports |
1.25 (10.86) |
10.90 (10.19) |
1.02 (13.13) |
5.06 (22.25) |
1.63 (13.05) |
4.52 (38.32) |
3.40 (9.78) |
2.37 (50.35) |
|
|
Lentil |
Exports |
5.22 (25.74) |
13.61 (24.31) |
12.80 (18.84) |
8.59 (61.74) |
-0.23 (21.70) |
2.47 (58.23) |
12.24 (25.47) |
3.52 (86.17) |
|
Imports |
5.51 (25.32) |
13.85 (23.09) |
15.83 (22.31) |
9.21 (61.84) |
7.77 (21.58) |
5.24 (57.46) |
11.09 (27.46) |
7.31 (86.66) |
|
|
Peas |
Exports |
-4.39 (13.23) |
11.94 (21.42) |
4.75 (19.24) |
3.52 (30.18) |
6.30 (13.61) |
4.76 (45.13) |
8.84 (8.94) |
6.61 (53.90) |
|
Imports |
-5.34 (8.74) |
10.71 (18.74) |
6.57 (22.61) |
3.85 (33.57) |
2.28 (17.65) |
3.21 (38.91) |
10.99 (13.34) |
3.53 (57.32) |
|
|
Soybean |
Exports |
4.59 (19.74) |
16.70 (19.62) |
1.76 (16.43) |
8.86 (53.61) |
7.86 (22.31) |
9.32 (55.93) |
7.65 (6.12) |
6.67 (80.80) |
|
Imports |
4.50 (20.85) |
15.82 (18.66) |
1.59 (16.17) |
8.60 (52.66) |
6.23 (20.62) |
4.79 (51.89) |
9.40 (6.58) |
6.77 (79.00)
|
|
|
Source: FAOSTAT, Figure in parenthesis indicates the CV (independent of unit). |
|||||||||
Table 12: Growth rate and Instability of Export-Import Quantity and Price of Legumes in the World (1990-91 to 2017-18).
|
Continent |
Crops |
Variables |
Export-Import Price Elasticity of Legumes |
|||
|
1990-91 to 2000-01 |
2001-02 to 2011-12 |
2012-13 to 2017-18 |
1990-91 to 2017-18 |
|||
|
ASIAN |
Beans |
Exports |
1.78 |
0.15 |
1.01 |
0.17 |
|
|
Imports |
0.07 |
0.27 |
0.26 |
0.31 |
|
|
|
Chickpea |
Exports |
1.10 |
-0.14 |
-4.13 |
-0.23 |
|
|
Imports |
0.98 |
0.00 |
0.80 |
0.43 |
|
|
|
Groundnut |
Exports |
-0.16 |
0.20 |
0.00 |
0.30 |
|
|
Imports |
-0.30 |
0.20 |
1.58 |
0.50 |
|
|
|
Lentil |
Exports |
2.95 |
-0.02 |
0.98 |
0.47 |
|
|
Imports |
1.20 |
0.40 |
0.86 |
0.70 |
|
|
|
Peas |
Exports |
0.86 |
0.45 |
2.25 |
0.75 |
|
|
Imports |
0.24 |
0.38 |
1.92 |
1.00 |
|
|
|
Soybean |
Exports |
1.08 |
0.02 |
-3.99 |
-1.19 |
|
|
Imports |
1.31 |
0.26 |
4.79 |
0.61
|
|
|
Source: FAOSTAT Figure in parenthesis indicates the CV (independent of unit) |
||||||
Table 13: Export Import Price Elasticities of Legumes in the Asian Continent (1990-91 to 2017-18).
|
Continent |
Crops |
Variables |
Export- Import Price Elasticity of Legumes |
|||
|
1990-91 to 2000-01 |
2001-02 to 2011-12 |
2012-13 to 2017-18 |
1990-91 to 2017-18 |
|||
|
American |
Beans |
Exports |
-0.77 |
0.18 |
6.86 |
0.50 |
|
Imports |
-0.34 |
0.16 |
0.82 |
0.58 |
||
|
Chickpea |
Exports |
1.22 |
-1.75 |
1.01 |
0.58 |
|
|
Imports |
0.71 |
0.18 |
1.26 |
0.54 |
||
|
Groundnut |
Exports |
0.50 |
0.30 |
3.56 |
0.34 |
|
|
Imports |
1.02 |
0.19 |
-1.4 |
0.65 |
||
|
Lentil |
Exports |
1.48 |
0.28 |
0.74 |
0.64 |
|
|
Imports |
1.29 |
0.15 |
0.74 |
0.44 |
||
|
Peas |
Exports |
2.28 |
0.21 |
2.25 |
0.87 |
|
|
Imports |
2.72 |
-0.07 |
2.76 |
0.72 |
||
|
Soybean |
Exports |
1.44 |
0.16 |
6.07 |
0.54 |
|
|
Imports |
1.48 |
-0.41 |
3.63 |
0.59 |
||
|
Source: FAOSTAT. |
||||||
Table 14: Export Import Price Elasticities of Legumes in the American Continent (1990-91 to 2017-18).
|
Continent |
Crops |
Variables |
Export- Import Price Elasticity of Legumes |
|||
|
1990-91 to 2000-01 |
2001-02 to 2011-12 |
2012-13 to 2017-18 |
1990-91 to 2017-18 |
|||
|
African |
Beans |
Exports |
3.20 |
0.48 |
2.05 |
0.64 |
|
Imports |
1.04 |
0.47 |
-14.36 |
0.77 |
||
|
Chickpea |
Exports |
-0.29 |
0.50 |
0.14 |
0.57 |
|
|
Imports |
0.72 |
-0.06 |
0.35 |
0.26 |
||
|
Groundnut |
Exports |
-0.42 |
-0.04 |
2.66 |
0.75 |
|
|
Imports |
3.57 |
0.30 |
1.57 |
0.68 |
||
|
Lentil |
Exports |
1.12 |
-1.98 |
1.16 |
-0.95 |
|
|
Imports |
1.85 |
0.09 |
0.68 |
0.44 |
||
|
Peas |
Exports |
1.29 |
0.90 |
0.88 |
0.62 |
|
|
Imports |
1.51 |
0.37 |
0.94 |
0.80 |
||
|
Soybean |
Exports |
0.93 |
0.37 |
1.48 |
0.50 |
|
|
Imports |
1.11 |
0.36 |
1.58 |
0.43 |
||
|
Source: FAOSTAT. |
||||||
Table 15: Export Import Price Elasticities of Legumes in the African Continent (1990-91 to 2017-18).
|
Continent |
Crops |
Variables |
Export- Import Price Elasticity of Legumes |
|||
|
1990-91 to 2000-01 |
2001-02 to 2011-12 |
2012-13 to 2017-18 |
1990-91 to 2017-18 |
|||
|
European |
Beans |
Exports |
-7.83 |
0.28 |
2.67 |
0.75 |
|
Imports |
-0.64 |
0.11 |
-0.06 |
0.31 |
||
|
Chickpea |
Exports |
0.86 |
0.65 |
0.29 |
0.56 |
|
|
Imports |
0.65 |
-0.12 |
0.79 |
0.33 |
||
|
Groundnut |
Exports |
2.04 |
0.39 |
-5.13 |
0.51 |
|
|
Imports |
-2.48 |
0.15 |
-4.59 |
0.37 |
||
|
Lentil |
Exports |
7.33 |
0.23 |
1.01 |
0.61 |
|
|
Imports |
2.48 |
0.01 |
0.62 |
0.33 |
||
|
Peas |
Exports |
0.64 |
0.08 |
2.26 |
3.50 |
|
|
Imports |
0.16 |
-2.29 |
-0.28 |
1.12 |
||
|
Soybean |
Exports |
1.55 |
0.25 |
23.89 |
0.68 |
|
|
Imports |
-0.93 |
-0.23 |
-1.31 |
0.19
|
||
|
Source: FAOSTAT. |
||||||
Table 16: Export Import Price Elasticities of Legumes in the European Continent (1990-91 to 2017-18).
|
Continent |
Crops |
Variables |
Export- Import Price Elasticity of Legumes |
|||
|
1990-91 to 2000-01 |
2001-02 to 2011-12 |
2012-13 to 2017-18 |
1990-91 to 2017-18 |
|||
|
World |
Beans |
Exports |
7.66 |
0.20 |
0.48 |
0.41 |
|
Imports |
-1.32 |
0.26 |
0.17 |
0.50 |
||
|
Chickpea |
Exports |
1.23 |
0.10 |
0.79 |
0.51 |
|
|
Imports |
0.82 |
0.00 |
0.87 |
0.46 |
||
|
Groundnut |
Exports |
1.11 |
0.23 |
-3.88 |
0.36 |
|
|
Imports |
2.19 |
0.18 |
7.40 |
0.49 |
||
|
Lentil |
Exports |
1.68 |
0.26 |
0.84 |
0.69 |
|
|
Imports |
1.49 |
0.26 |
0.87 |
0.65 |
||
|
Peas |
Exports |
-0.70 |
0.18 |
2.62 |
1.00 |
|
|
Imports |
0.05 |
0.16 |
2.09 |
0.87 |
||
|
Soybean |
Exports |
1.47 |
0.16 |
6.20 |
0.55 |
|
|
Imports |
1.52 |
0.18 |
6.44 |
0.56
|
||
|
Source: FAOSTAT. |
||||||
Table 17: Export Import Price Elasticities of Legumes in the World (1990-91 to 2017-18).
Citation: Dastagiri MB, Ch. Srinivasa Rao, Naga Sindhuja PV (2019) Global and Continental Legumes: Growth and Developments in Area, Production and Trade. Open Acc J Agri Res: OAJAR-100024.