
Emergency Medicine and Trauma Care Journal
Research Article
Life Quality of Elderly People
Shabani Z1*, Pllumi A2, Paçrami S3, Banishta S4 and Piranej E5
Department of Nursing, University of Shkodra “Luigj Gurakuqi”, Albania
*Corresponding author: Zamira Shabanis, Department of Nursing, University of Shkodra “Luigj Gurakuqi”, Albania, Tel: +355 22 800 651; Email: habanizamira@yahoo.com
Citation: Shabani Z, Pllumi A, Paçrami S, Banishta S and Piranej E (2019) Life Quality of Elderly People. Emerg Med Trauma Care J: EMTCJ-100012
Received date: 10 October, 2019; Accepted date: 15 October, 2019; Published date: 22 October, 2019
Abstract
Aim: The third age is considered by many as the "golden years" of adulthood. It is generally defined as the time gap between retirement and the beginning of the imposed physical age, emotional and cognitive limitations. This is a period of adulthood when it typically has fewer responsibilities than before. The aim of this study is to evidence the life satisfacion among geriatric people.
Methods: In this study were included 100 old people over 50 years from Shkodra District. Questionnaires were conducted in face-to-face communication to the: elderly home of Shkodra city, in health centers of village and town. Interviews with health centers were conducted with casual individuals when they were presented to receive medical service at the family doctor. Prior to the completion of the questionnaire, the consensus of the interviewees was taken and anonymity was kept. The questionnaire used is the standardized international questionnaire. The level of life satisfaction was rank as: no satisfied, satisfied and very satisfied. The questionnaire filling period was 1 to 20 March 2019. Data processing was used by Microsoft Office 2010.
Results: 52% of samples were female and 48% male. 52% of them were from urban area and 48% from rural area. 26% of them were 50-59 years old, 50% were 60-69 years old and 24% over 70 years old. Maximum 76-year-old, minimum 53-year-old, average 64.1year old, STDEV±6.16 year.
Conclusions: The most people are satisfied (70%). This is related with our tradition that the elderly people live with their children in big family. The female people are more satisfied (42%). The satisfaction is at the level 80.8% between all female. Pearson Corel between gender and life satisfaction result (r =0.041). The age group most satisfied is 60-69 years old (38% of the sample). Increasing the age, the satisfaction of life decrease. Pearson Corel between age and life satisfaction results (r = -0.31).
Keywords: life; Old; Satisfaction; Shkodër
Introduction
The world's population is aging rapidly. Between 2015 and 2050, the percentage of adult age in the world is estimated to be almost double from about 12% to 22%. In absolute terms, this is an expected increase of 900 million to 2 billion people over the age of 60 [1,2]. The problems and the quality of life of elderly people are often complex, multifactorial and multidimensional. The quality of life depends on the emotional interpretation the subject gives to the facts and events. The quality of life is strongly acknowledged as an assessment strongly dependent on the person's subjectivity [1]. Previous research has shown that life satisfaction was higher among older adults of lower age, being male and who were living in ordinary housing. Higher life satisfaction was also reported among older adults that had a higher self-care capacity, a better perceived overall health, higher level of physical activity and that had better economic resources [3]. Social isolations, lower level of education, loneliness and depression are mentioned as the predictors of functional status in the population of old people. Functional and physical impairment are factors believed to lead to declined life satisfaction [4]. In general women still have less material resources than men, which also can affect life satisfaction through lower standard of living and through economic worries [5]. Age of patient significantly determines the functional status. It is estimated that after the 30 years of life, a person loses 1% of functional ability each year [6]. Especially noticeable decrease in functional status is after the 85 years.
Matherial and Methods
The aim of this study is to evidence the life satisfacion among geriatric people. In this study were included 100 old people over 50 years from Shkodra District. 52% of them were female and 48% male. 52% of them were from urban area and 48% from rural area. 26% of them were 50-59 years old, 50% were 60-69 years old and 24% over 70 years old. Max 76-year-old, min 53-year-old, average 64.1year old, STDEV ± 6.16 year. Questionnaires were conducted in face-to-face communication to the elderly home of Shkodra city, in health centers in the village and town. Interviews with health centers were conducted with casual individuals when they were presented to receive medical service at the family doctor. The questions were closed. Prior to the completion of the questionnaire, the consensus of the interviewees was taken and anonymity was kept.
The questionnaire used is the standardized international questionnaire. The Life Satisfaction Index A. was used. The Life Satisfaction Index (LSI) covers general feelings of well-being among older people to identify “successful” aging [7]. As used by the concept of life satisfaction is closely related to morale, adjustment, and psychological well-being. The original, Version A (LSIA), comprises 20 items, of which 12 are positive and eight are negative. An agree/disagree response format is used. Problems with coding “undecided” responses then prompted the use of a three-point scale, rating a satisfied response as 2, an uncertain response as 1, and a dissatisfied response as 0, giving a range of 0 to 40 [8].
No satisfied, satisfied, very satisfied. The LSIA was developed empirically by administering a draft version of the questionnaire to two groups of people considered to differ in their level of life satisfaction. This difference had been established on the basis of the Life Satisfaction Rating Scale, also developed. The Rating Scale is scored by a professional and also reflects the five components of life satisfaction hypothesized by the authors [7]. Questions in the draft scale that differentiated successfully between high and low scorers on the Rating Scale were selected for the LSIA, which is self-administered. The level of life satisfaction was rank as: no satisfied (0-20 point), satisfied (21-30 point) and very satisfied (>30 point). The questionnaire filling period was 1 to 20 March 2018. Data processing was used by Microsoft Office 2010.
Result
In this study were included 100 old people over 50 years old from Shkodra District. 52% of them were femail and 48% male, 52% from urban area and 48% rural area. 26% of them were 50-59 years old, 50% were 60-69 years old and 24% over 70 years old. Max 76-year-old, min 53-year-old, average 64.1yaers old, STDEV ± 6.16 year.
As we can see in the figure nr.1, the most of old people are satisfied (70%). This is a good sign. This is related with our tradition that the elderly people live with their children in big family. For now, there are not abandoned. Over the years with the demographic changes of our population, with the massive emigration of youth, very soon the third age will remain lonely. In the future this will be reflected also at the life satisfaction at the Albanian geriatric people. These people feel useful for their families and live in community with their peers. Their children look after their health and a part of their expenses are covered. This is a significant factor that increases the level of satisfaction and gives them security for life. In the less developed countries, the social support and traditional function of the family are the most important contributions to the overall quality of life for elderly. The problem of isolation is more present in the developed world, but the local community is much more organized to compensate the role of family.
In the Table 1 we can see that only 32% of elders think that getting older has gone better than they thought, 26% disagree and 42% didn`t know. 48% of them have gotten more of the breaks in life than most of the people that they know, 12% disagree and 40% didn`t know. Only 26% of them think that this is the dreariest time of the life, 36% disagree and 38% didn`t know. Also 38% of them declare that they are as happy as when they were younger, 24% disagree and 38% didn`t know 24% of them think that their life could be happier than it is now, 32% disagree and 44% didn`t know. 36% of them refer that these are the best years of their life, 30% disagree and 34% didn`t know.
One third part of them considers that the most of the things they do are boring or monotonous but 30% disagree and 40% didn`t know. 34% of sample expects some interesting and pleasant things to happen to them in the future but 28% disagree and 38% didn`t know they don't know if it's going to happen to them. 40% think that the things they do are as interesting to their as they ever were but 24% disagree and 36% didn`t know. Only 18% feel old and somewhat tired and 44% don't feel so but 38% didn`t know how they feel. 42% feel their age, but it does not bother them, 24% don't feel so but 34% didn`t know how they feel. 38% are fairly well satisfied when as they look back on their life but 28% don't feel so and 34% didn`t know how they feel. 40% of them refer that they would not change their past life even if they could, 22% disagree and 34% they don't know what they would have done. Only 24% declare that compared to other people of their age, they have made a lot of foolish decisions in their life, 38% disagree and 38% are not sure about this. 30% think that they make a good appearance, but 32% disagree and 38% didn`t know. 44% of these people have made plans for things in the coming months because 42% of them think that they didn't get most of the important things they wanted. By the other hand 22% didn`t made plans and 34% didn`t know what they will do in the future. Also 30% think that they have get the most important things in their life but 28% are not sure about this.
Only 24% refer that they get down in the dumps too often, 40% disagree and 36% didn`t know. 40% of people have gotten pretty much what they expected out of life and are optimists about the future of their life, but 26% are not and 34% didn`t know they expects. 26% of people think that the lot of the average man is getting worse, but 40% do not agree with this opinion and 34% didn`t know.
The Figure 2 is evidenced the correlation between life satisfaction and gender? In total of sample the female people are more satisfied (42%). The satisfaction is at the level 80.8% between all female. It is significant correlation. Pearson Corel between gender and life satisfaction result (r=0.041) (Figure 3). This is related to the role of the grandmother in the family. In our tradition are the grandmothers who care for young children and in many cases they are (in charge of the family) head of household. Also we can see in the figure 2 and 3, the men of old age experience higher levels of life satisfaction than women. (2% men vs 0% for women of sample, or 4.2% of men versus 0% of women).
In the (Figure 4) we can see that the age group most satisfied is 60-69 years old (38% of total of the sample). This people are yet active and this is reflected in 76% of this group. (see figure 5). The functional status is a very important factor for a person's evaluation of each overall health status as 'good' or 'bad' and it constitutes in many cases the key concept for individuals, especially the old. Bad functional status is one of the physical status variables leading to the more frequent use of health services, especially in the population of old people. At the same time, physical and cognitive function deficits are among primary predictors of decreased quality of life in home-dwelling elders.
Increasing the age decrease the life satisfaction. As we can see this correlation is negative. Pearson Corel between age and life satisfaction result (r=-0.31).
Conclusion
The most of old people are satisfied because for now there are not abandoned. This is related with our tradition that the elderly people live with their children in big family. Increasing the age decrease the life satisfaction. The female old people are more satisfied related this to the role of the grandmother in the family. Over the years with the demographic changes of our population, with the massive emigration of youth, very soon the third age will remain lonely. In the future this will be reflected also at the life satisfaction at the Albanian geriatric people.
Recommendation
The older persons should remain integrated in society, regarded as contributors to and agents of development, participating actively in the formulation and implementation of policies that directly affect their well-being. The empowerment of elderly population, their full participation in the society and promotion of all their functional capacities are essential elements for principle of “active aging”.
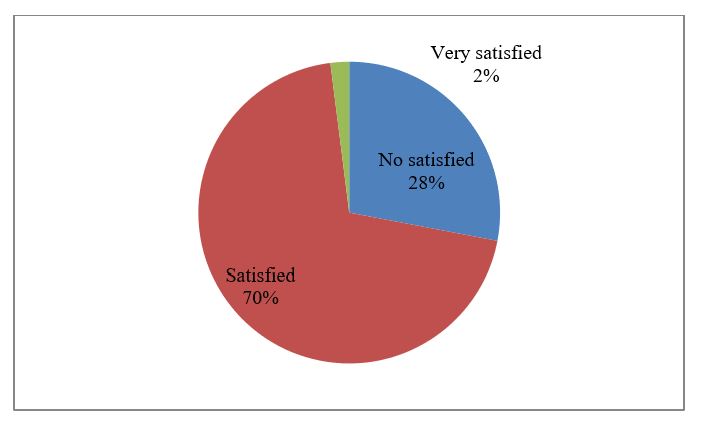
Figure 1: The level of life satisfaction among elderly people.
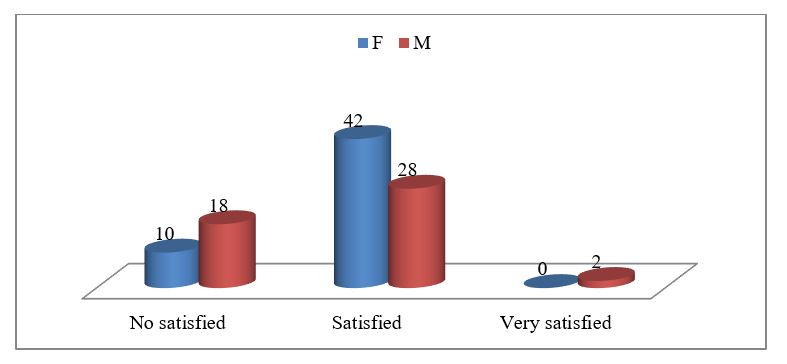
Figure 2: The level of life satisfaction at the elderly people according to the gender.
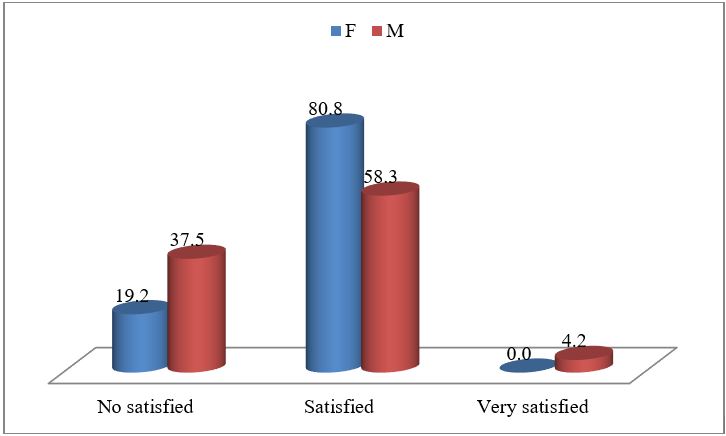
Figure 3: The level of life satisfaction at the elderly people according to the gender.

Figure 4: The level of Life Satisfaction at the elderly people according to the age.

Figure 5: The level of life satisfaction at the elderly people according to the age.
|
S.NO |
- |
Agree |
Disagree |
I Don’t know |
|
1. |
As I grow older, things seem better than I thought they would. |
32% |
26% |
42% |
|
2. |
I have gotten more of the breaks in life than most of the people I know. |
48% |
12% |
40% |
|
3. |
This is the dreariest time of my life. |
26% |
36% |
38% |
|
4. |
I am just as happy as when I was younger. |
38% |
24% |
38% |
|
5. |
My life could be happier than it is now. |
24% |
32% |
44% |
|
6. |
These are the best years of my life. |
36% |
30% |
34% |
|
7. |
Most of the things I do are boring or monotonous. |
30% |
30% |
40% |
|
8. |
I expect some interesting and pleasant things to happen to me in the future. |
34% |
28% |
38% |
|
9. |
The things I do are as interesting to me as they ever were. |
40% |
24% |
36% |
|
10. |
I feel old and somewhat tired. |
18% |
44% |
38% |
|
11. |
I feel my age, but it does not bother me. |
42% |
24% |
34% |
|
12. |
As I look back on my life, I am fairly well satisfied. |
38% |
28% |
34% |
|
13. |
I would not change my past life even if I could. |
40% |
22% |
38% |
|
14. |
Compared to other people my age, I’ve made a lot of foolish decisions in my life. |
24% |
38% |
38% |
|
15. |
Compared to other people my age, I make a good appearance. |
30% |
32% |
38% |
|
16. |
I have made plans for things I’ll be doing a month or a year from now. |
44% |
22% |
34% |
|
17. |
When I think back over my life, I didn’t get most of the important things I wanted. |
42% |
30% |
28% |
|
18. |
Compared to other people, I get down in the dumps too often. |
24% |
40% |
36% |
|
19. |
I’ve gotten pretty much what I expected out of life. |
40% |
26% |
34% |
|
20. |
In spite of what people say, the lot of the average man is getting worse, not better. |
26% |
40% |
34% |
Table 1: Life satisfaction of geriatric people.
Citation: Shabani Z, Pllumi A, Paçrami S, Banishta S and Piranej E (2019) Life Quality of Elderly People. Emerg Med Trauma Care J: EMTCJ-100012